Last months performance was decent. I want to remind everyone that my wife gave birth to our dear daughter Maya. Like any other dad, I was around them and on top of that helping with my other two daughters. Still almost 10% gain based on $20,000 dollars invested. So not bad at all in my
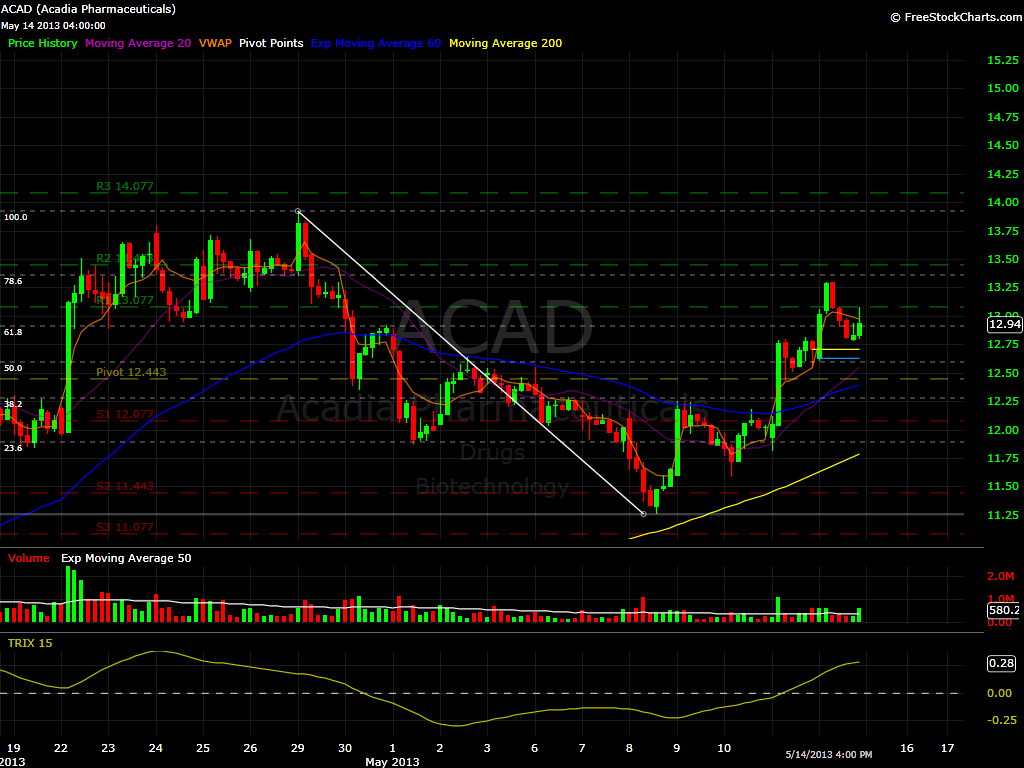
$ACAD Hourly Chart - Over 13.36 looks like agood entry for a long. $ALXA 30 min chart - Over 4.85 is a good long. $CETV Hourly chart - Watch it over 3.01 launch poad. $CSIQ 3 day chart - This is not a solar stock that moves like the other ones. This one will demand
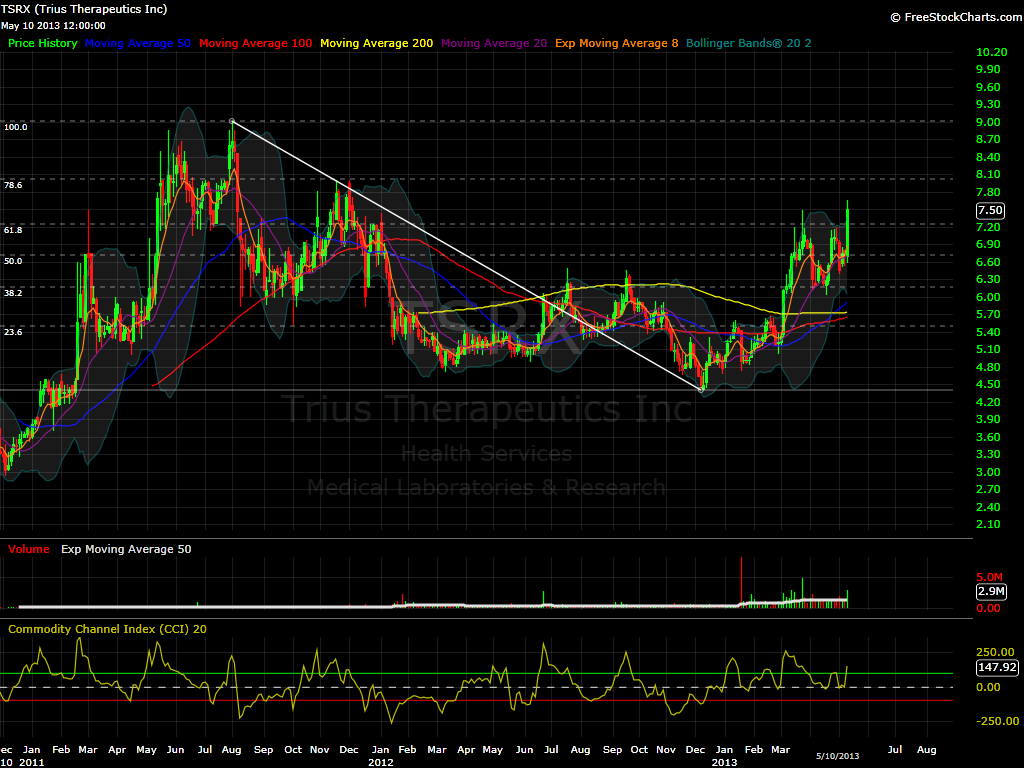
$TSRX 2 day chart - I am watching the 8.02 level after this pre-market pop. If the stock opens. The 61.8% Fibonacci level is at 7.25. I did set an alert to that level in the morning. If it drops to that level and hold, I will take it long with a 8.02 target. $UNIS

$AMRN 2 Hour Chart - Nice pre-market action, I would wait for it to pullback and hold 6.97 before getting serious long. $AMZN 15 min chart - Don't touch it until it croses 255. $ANAD 2 hour chart - Filling gap in pre-market, and jumping two Fibonacci levels. I would have to wait and see
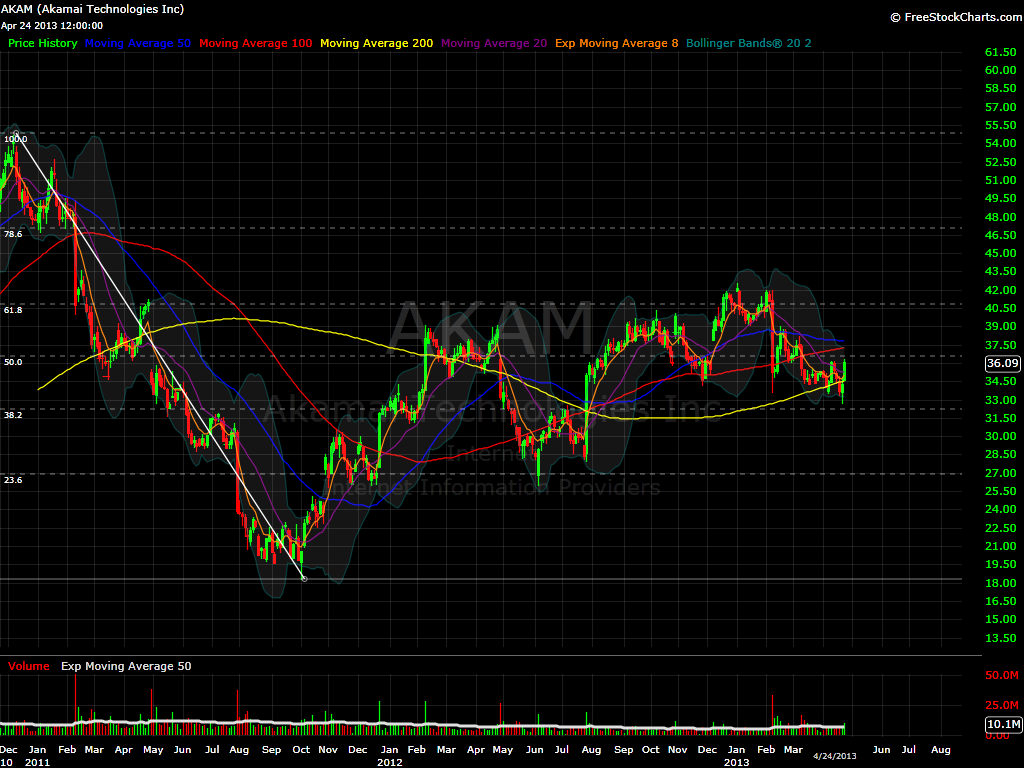
$AKAM 2 Day Chart - Nice pop after earnings, Opening betwen 2 Fibonacci levels, I think it goes higher, but it should pullback and hold the 40.88. If it does, and the market is still strong, then it may continue higher, maybe even a good swing overnight, with target at 47. $ALXN 15 min chart
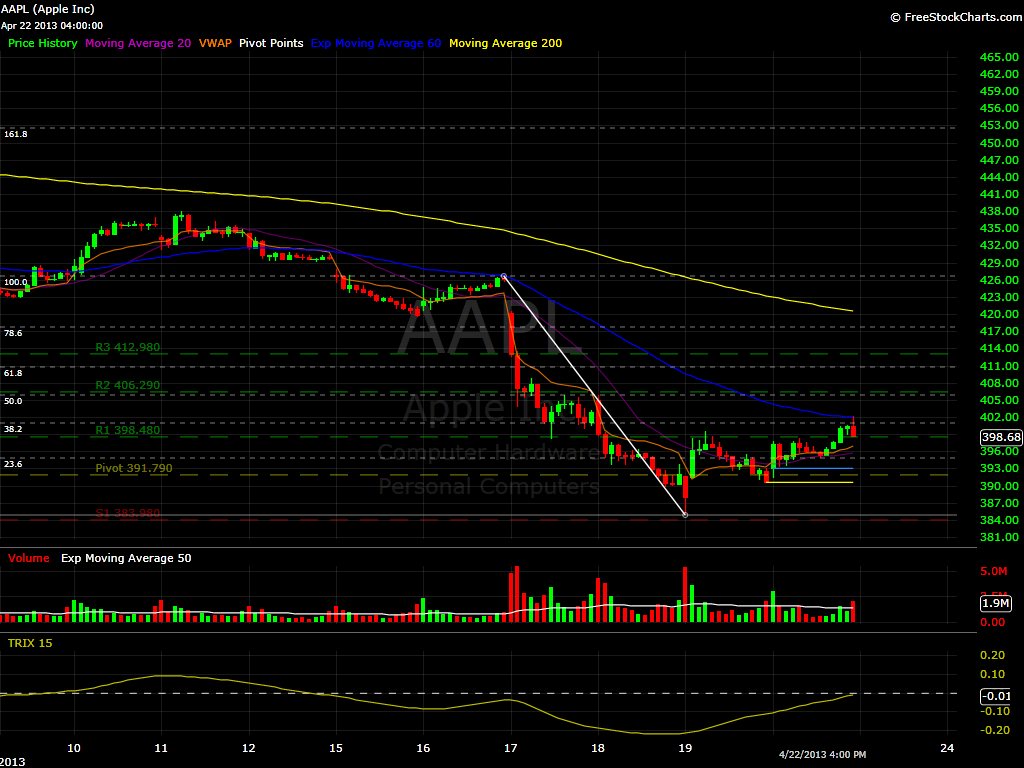
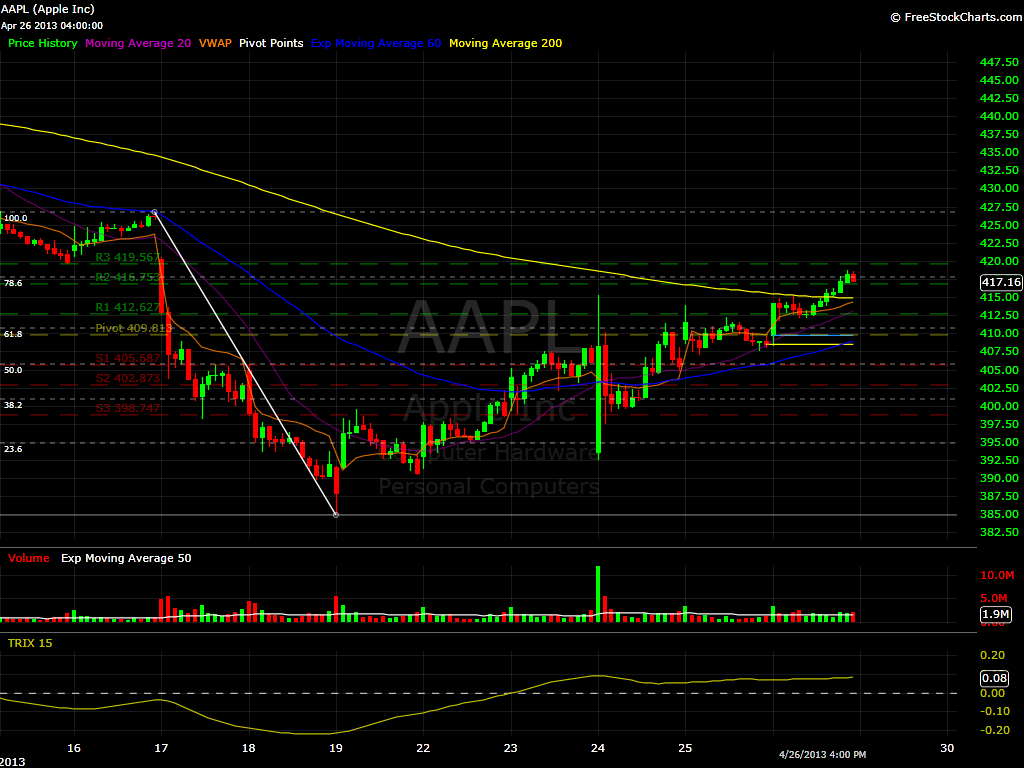
Apple (AAPL) 3 Day Chart - Nice move from the 385 level, that I tweeted about last week. It is currently above 400 which on a short term basis, correspond to the 38.2% Fibonacci Level. So as long as it stays above 400.90, it is a good long. Amarin (AMRN) 4 Hour - I want

$BBRY 30 min Chart - Nice setup forming, after it defended th 13 level. Over 13.98, with some volume it takes off from the launch pad. $GOLD 30 min chart - Major gap again, if it holds 73.50 (78.6% Fibonacci Level, I will be impressed) $HLIT Daily Chart - I will be watching this one
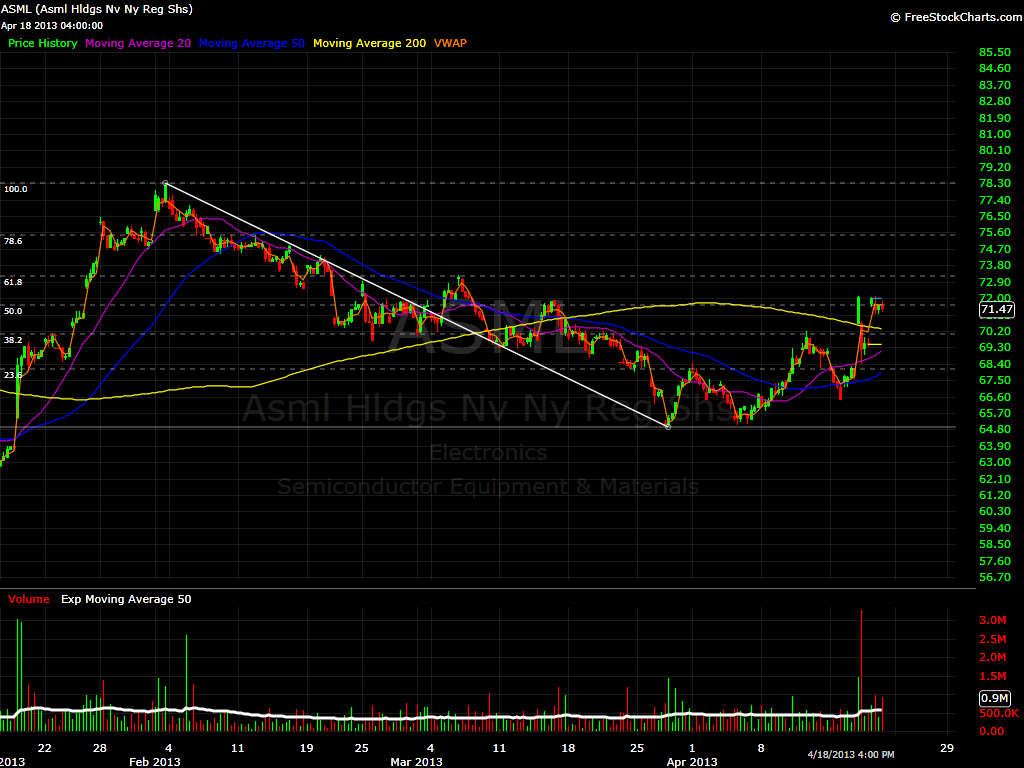
$ASML 2 Hour Chart - Gaping up, but between 2 fib levels, It looks more liekly it will go for the 73.20 target which represents the 61.8% Fibonacci level. If it does, that is usually the turning point. $GOLD 15 min chart - Another one opening in the middle of two Fibonacci levels. I highly

$ASML 2 Hour Chart - Doing the same thing it did yesterday. A nice gap, that most liekly will fade. Watch for 71.63 to hold. If it doesn't, you just short it, and maybe this time, it will go all the way down to 68.10. $GOLD 10 min Chart - Gaping two Fibonacci Levels, and

spc@shareplanner.com
(904) 800-8420
© Copyright 2025 | SharePlanner Inc. All Rights Reserved.
Disclaimer: The information provided on this website is for educational and informational purposes only. Ryan Mallory and/or SharePlanner are not licensed financial advisors, brokers, or tax professionals. The content on this site should not be considered as financial, investment, tax, or legal advice.
All information and opinions expressed herein are based on sources believed to be accurate and reliable. However, we make no representation or warranty as to their accuracy, completeness, or reliability. Any action you take upon the information on this website is strictly at your own risk.
Past performance is not indicative of future results. Investing involves risk, including the possible loss of principal. All investors should make their own decisions based on their specific investment objectives and financial circumstances.
This site may contain links to external websites that are not provided or maintained by or in any way affiliated with Ryan Mallory and/or SharePlanner. Please note that Ryan Mallory and/or SharePlanner do not guarantee the accuracy, relevance, timeliness, or completeness of any information on these external websites.
By using this website, you agree that Ryan Mallory and/or SharePlanner and any affiliated parties are not responsible for any losses or damages resulting from your use of or reliance on the information provided.
It is strongly recommended that you consult with a qualified professional before making any financial decisions.