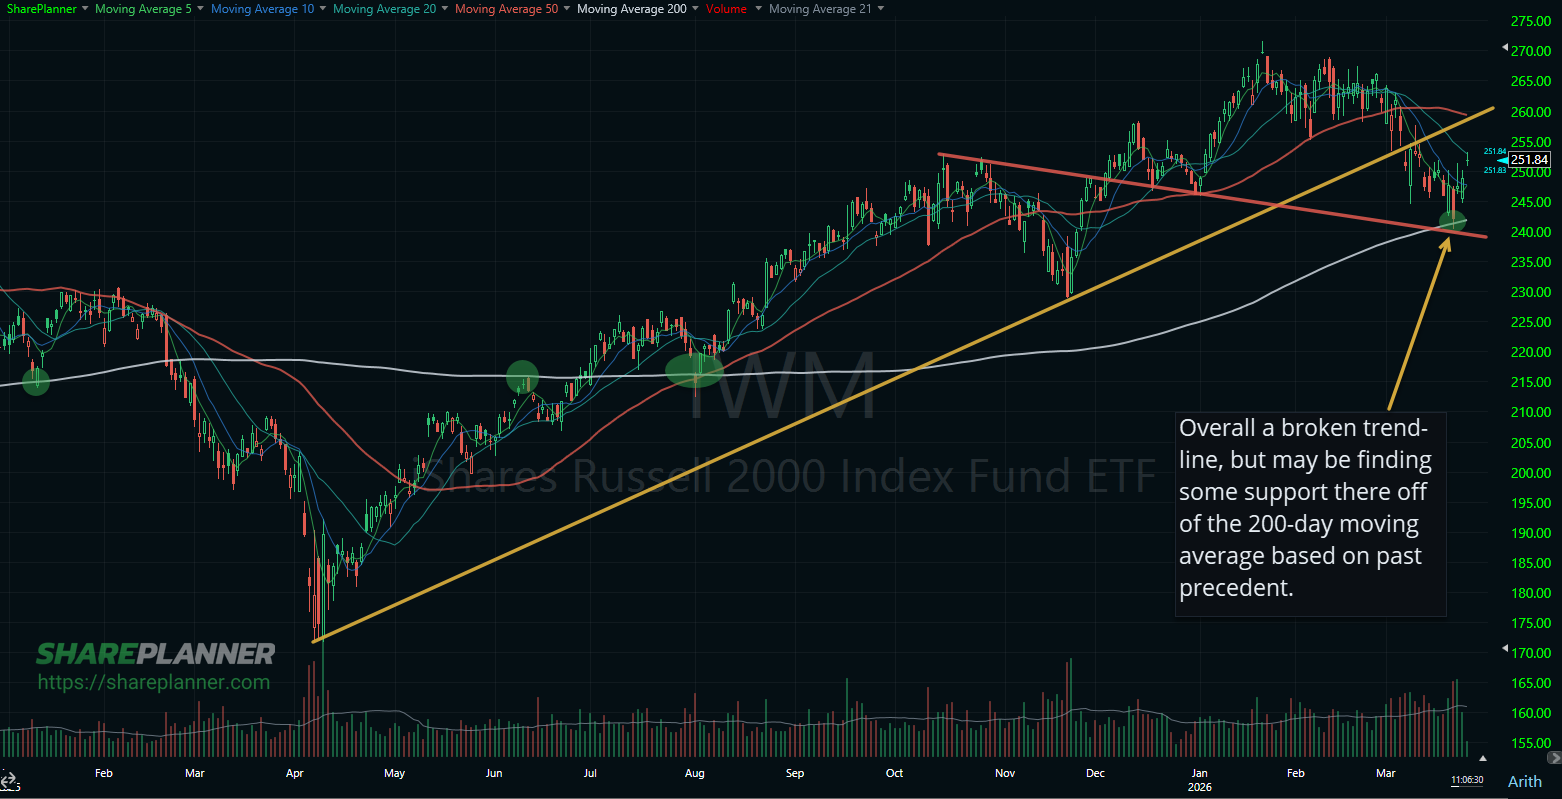
The Russell 2000 (IWM) continues to use the 200-day moving average as a bounce area for the index.

The stock market continues to show mixed signals, with SPY, QQQ, IWM, and Oil all sending different messages, following the war outbreak in Iran. In this video, I break down the technical analysis on each of these major ETFs and crude futures, review my key market indicators, and reveal what traders can expect next as
The overall market continues to frustrate traders with choppy, directionless price action. All three major index ETFs - SPY, QQQ, and IWM - remain range-bound, making it difficult to capture momentum or follow-through in either direction. In today’s video, I dive into each chart and examine: Where major support and resistance levels are forming How
After opening deep in the red, the market saw a sharp rebound across all major indices, with S&P 500 (SPY), Nasdaq 100 (QQQ), and Russell 2000 (IWM) all bouncing off the lows, though not recovering all the losses. We've seen a number of these huge sell-offs of late lead to massive rebounds in the days
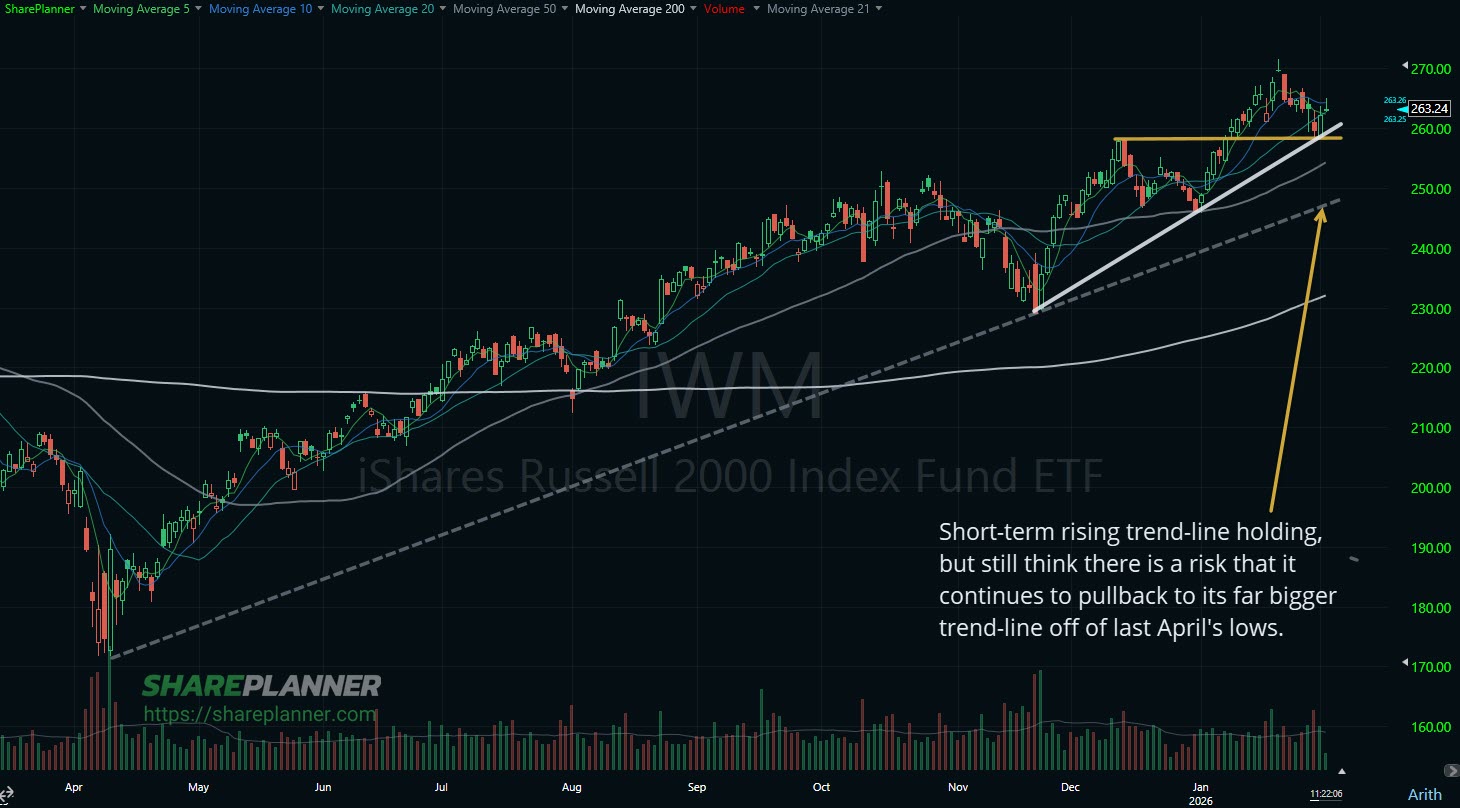
Its gone red since I drew up this chart, but still a nice series of higher highs and higher lows in place. But some reservation about a bigger pullback.
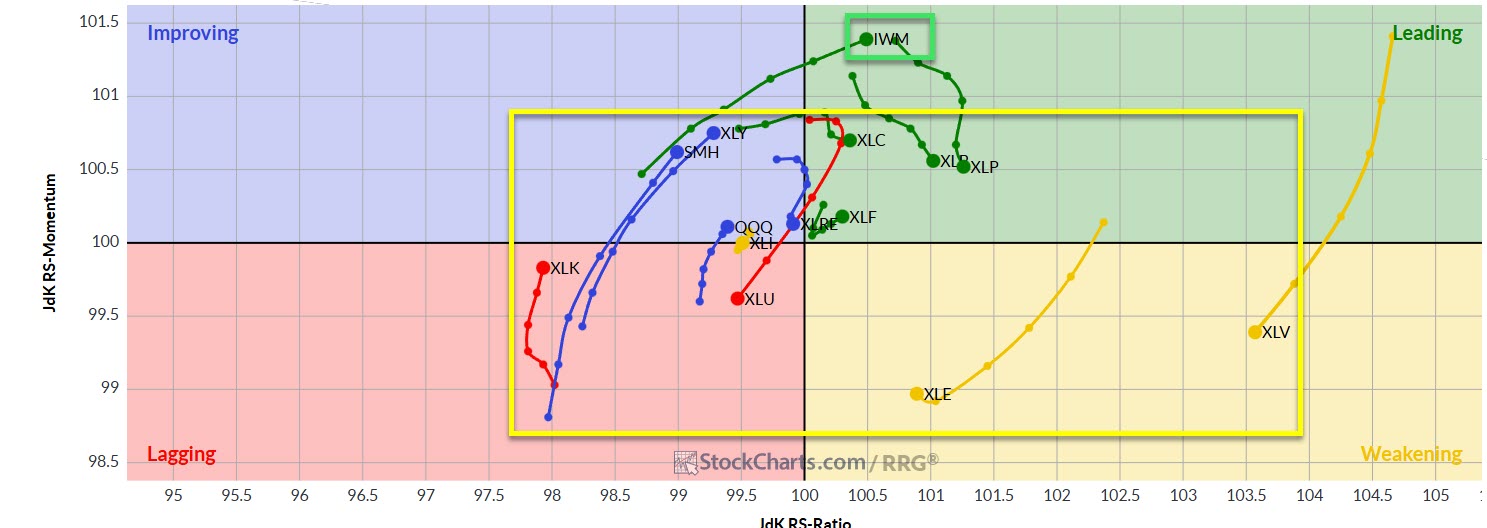
Only Russell 2000 (IWM) is showing any real leadership under current market conditions. Everything else is simply circling the S&P 500 (SPY).
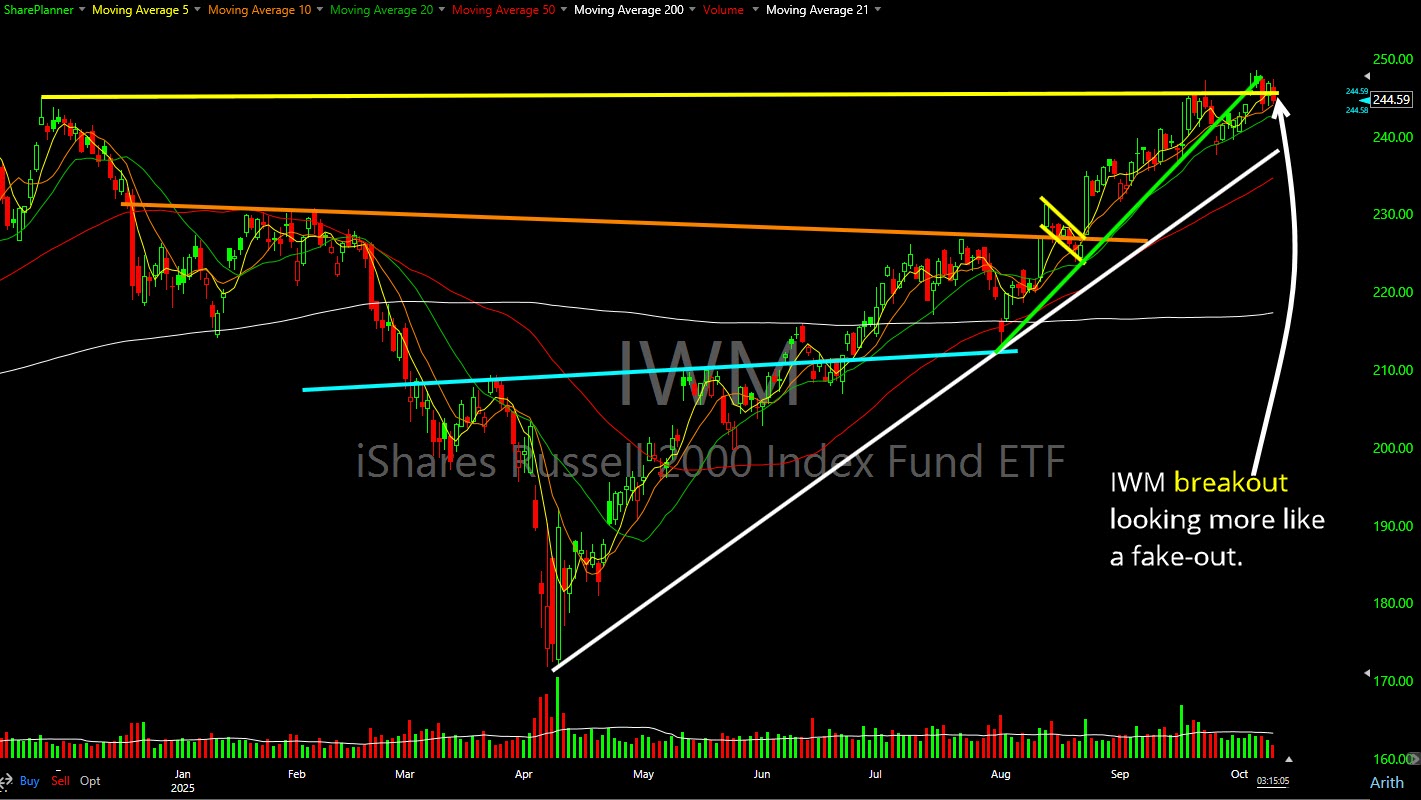
Russell 2000 (IWM) faking out traders who played the breakout at all-time highs.

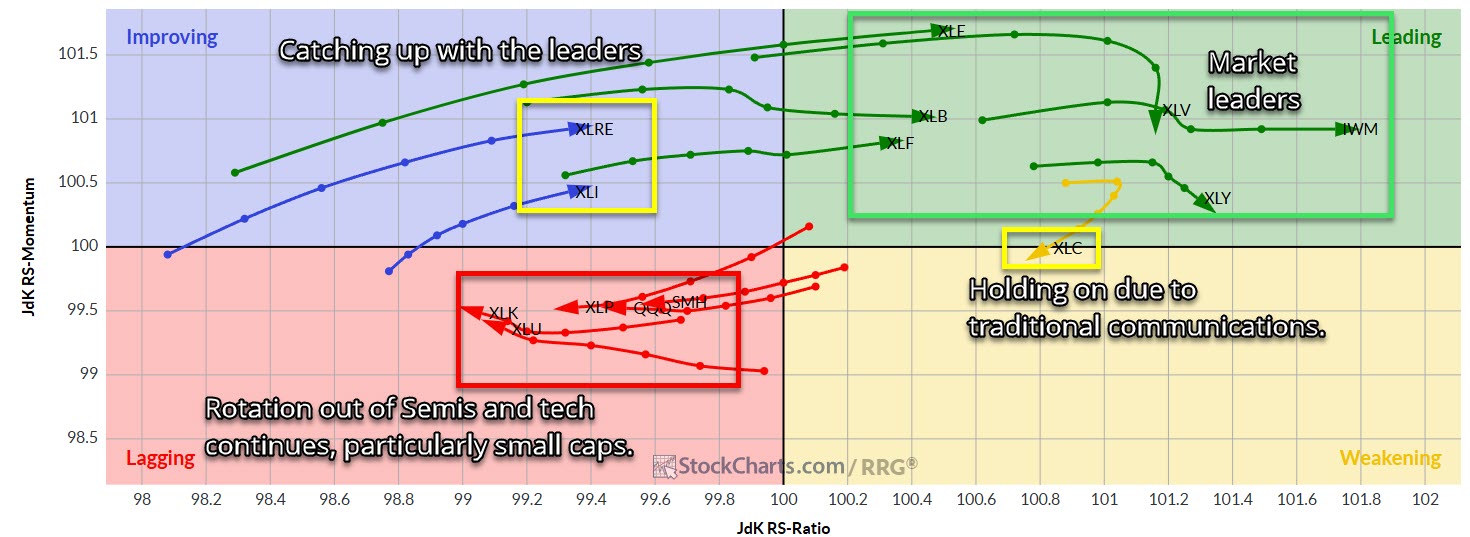
Technology sector is taking heavy losses this week, with Nvidia (NVDA) looking at a third straight week of losses. Meanwhile Russell 2000 (IWM) looking to rally for a fourth straight week.

Crazy divergence between the net longs on the Nasdaq 100 (QQQ) and the Russell 2000 (IWM).

spc@shareplanner.com
(904) 800-8420
© Copyright 2025 | SharePlanner Inc. All Rights Reserved.
Disclaimer: The information provided on this website is for educational and informational purposes only. Ryan Mallory and/or SharePlanner are not licensed financial advisors, brokers, or tax professionals. The content on this site should not be considered as financial, investment, tax, or legal advice.
All information and opinions expressed herein are based on sources believed to be accurate and reliable. However, we make no representation or warranty as to their accuracy, completeness, or reliability. Any action you take upon the information on this website is strictly at your own risk.
Past performance is not indicative of future results. Investing involves risk, including the possible loss of principal. All investors should make their own decisions based on their specific investment objectives and financial circumstances.
This site may contain links to external websites that are not provided or maintained by or in any way affiliated with Ryan Mallory and/or SharePlanner. Please note that Ryan Mallory and/or SharePlanner do not guarantee the accuracy, relevance, timeliness, or completeness of any information on these external websites.
By using this website, you agree that Ryan Mallory and/or SharePlanner and any affiliated parties are not responsible for any losses or damages resulting from your use of or reliance on the information provided.
It is strongly recommended that you consult with a qualified professional before making any financial decisions.