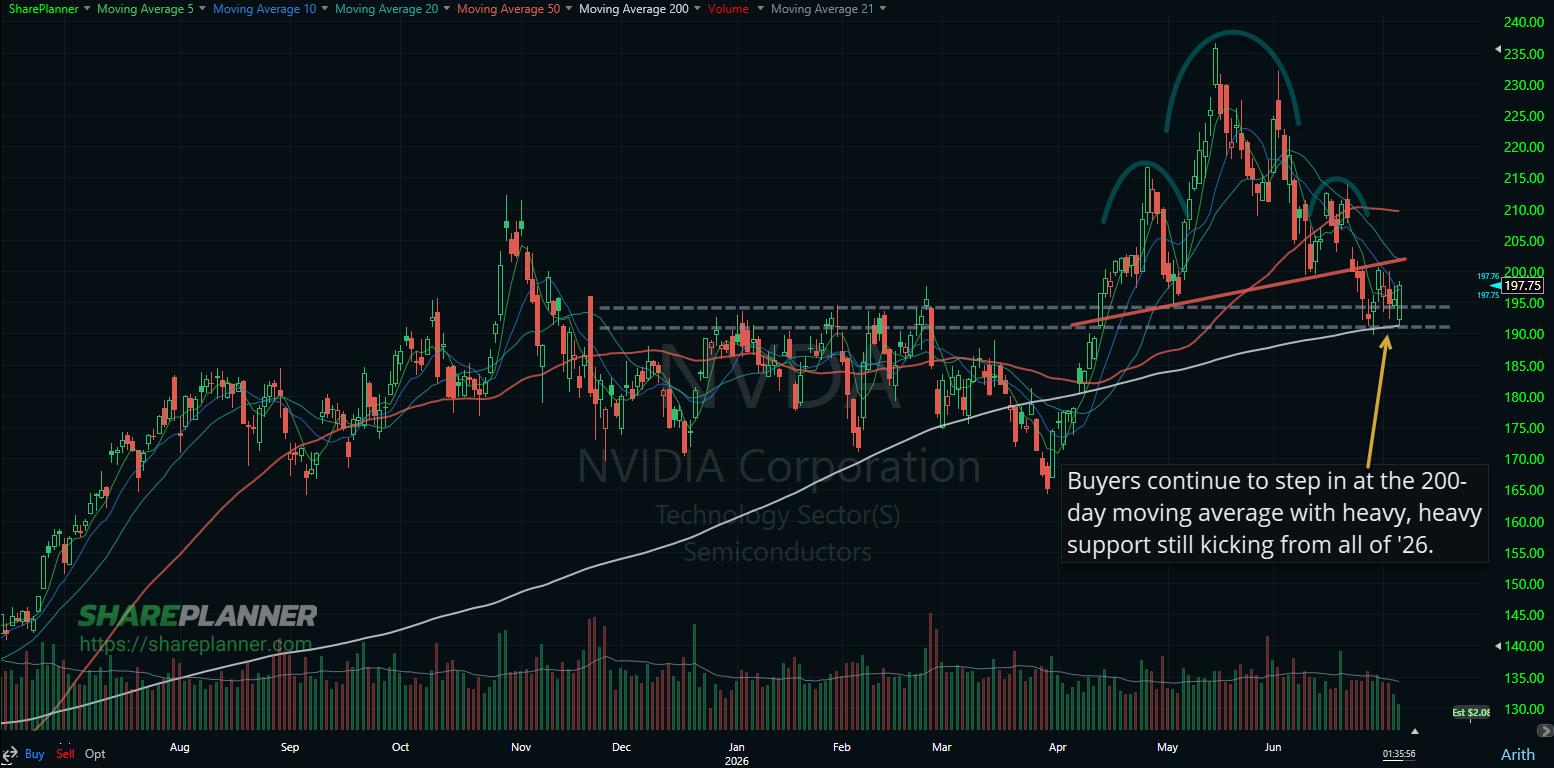
Nvidia (NVDA), even with its head and shoulders pattern, simply refuses to break below that all-important moving average and the support that goes along with it.
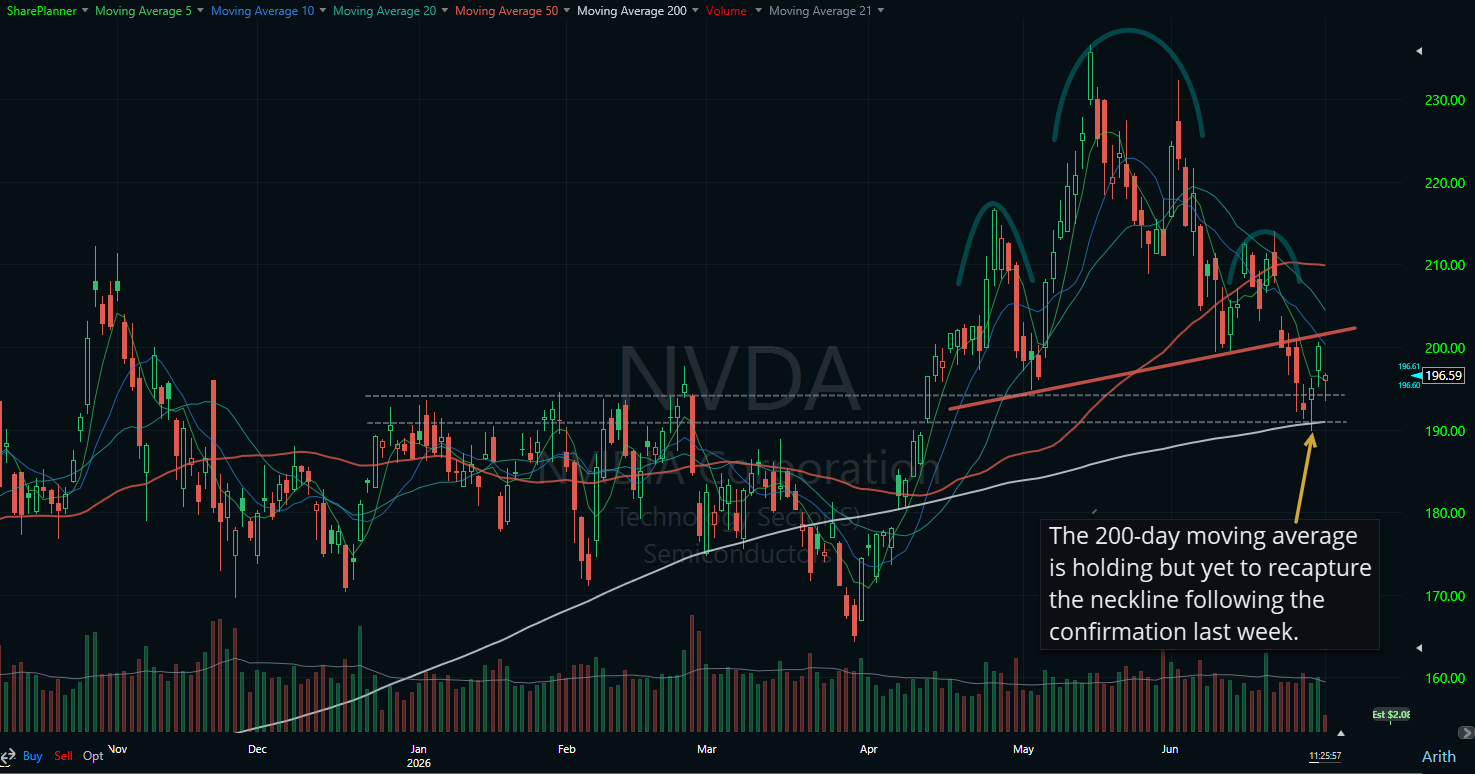
Nvidia (NVDA) is doing a solid job of holding support as well as the 200-day moving average. However testing the neckline yesterday, there's been some rejection in price, which could indicate there's more room for downside on the head and shoulders pattern. Ultimately the bulls are going to want to see the 6/30 highs broken
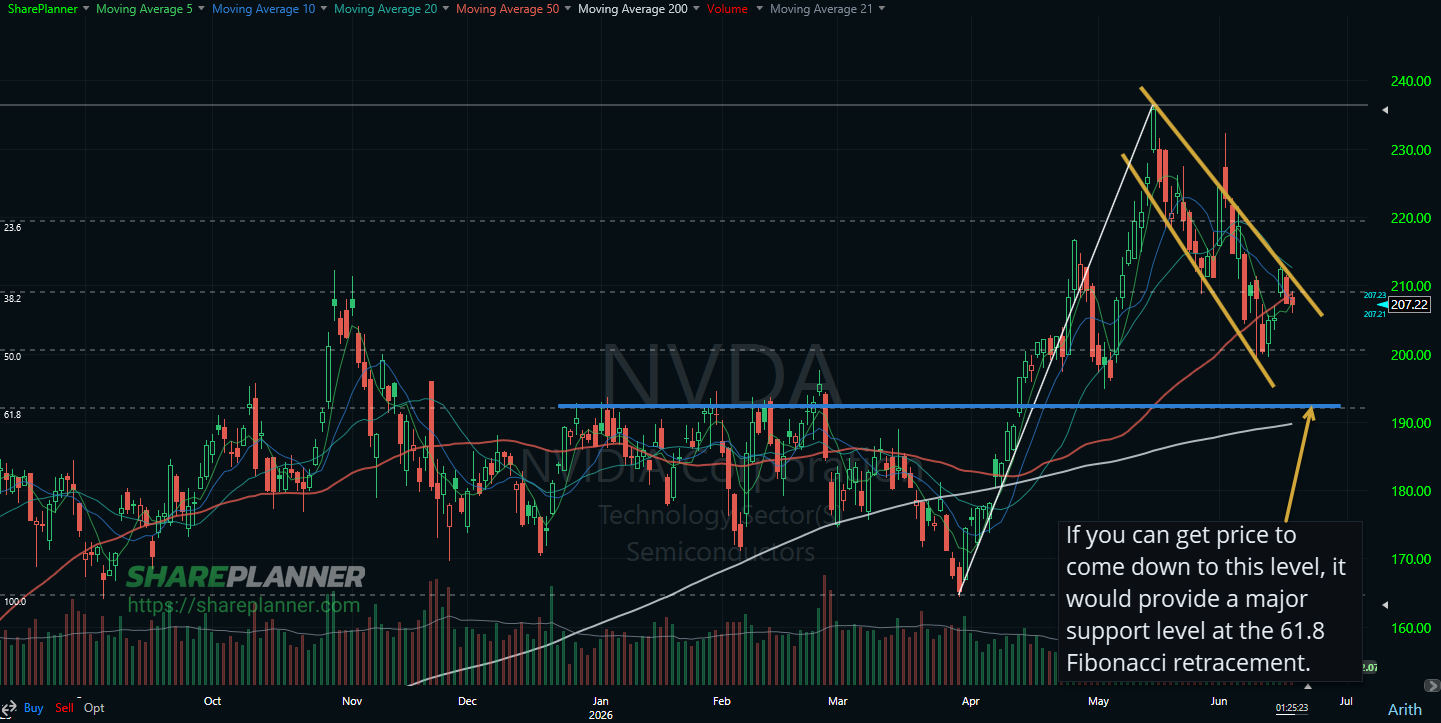
Nvidia (NVDA) is a pretty interesting chart here. Still in a pretty hard pullback that has recent found some short-term support off of the 50% retracement level. Before that, there was a decent bounce off of the 38.2% retracement, so there seems to be a lot of buyers watching these levels.
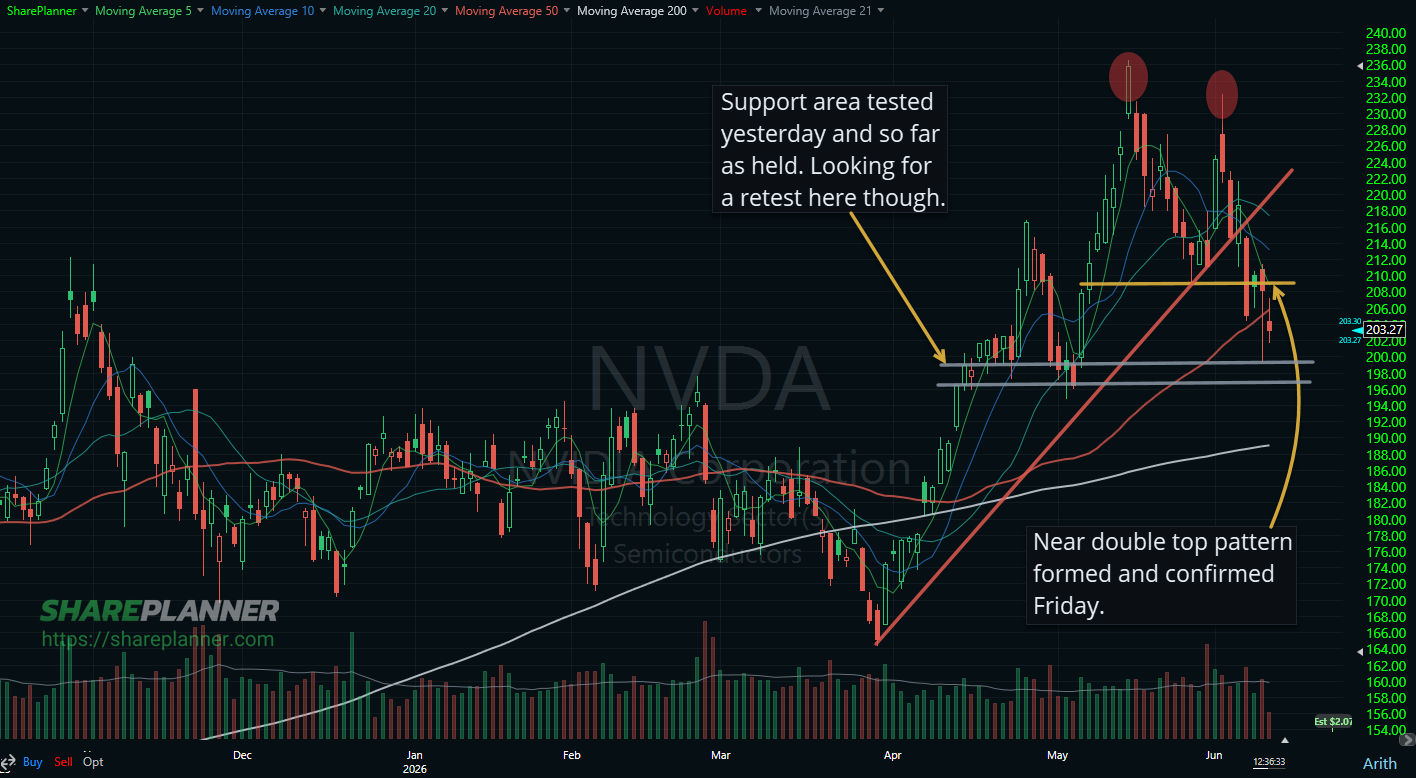
Nvidia (NVDA) has what is essentially a double top pattern, though the second top peaks just slightly lower than the first, the construction is still very similar to what you typically see.

Nvidia (NVDA) making a move finally, outside of its bull flag.

Checkout the bull flag forming on Nvidia (NVDA).

Advanced Micro Devices (AMD) rallying hard ahead of the Nvidia (NVDA) earnings after the bell, and breaking out of a bull flag, via gap higher.

The stock market has rallied hard in a short period of time, and that alone is not unusual. What stands out right now is what appears to be driving the move. This does not look like a broad, healthy advance led by widespread participation, steady earnings growth, or normal price discovery. Instead, the rally looks

Barely holding on to support, despite a continued rally in semis, this is a make or break moment for NVDA to bounce.

Pullback in Nvidia (NVDA) has the stock sitting on short-term support and potentially ready for the bounce.

spc@shareplanner.com
(904) 800-8420
© Copyright 2025 | SharePlanner Inc. All Rights Reserved.
Disclaimer: The information provided on this website is for educational and informational purposes only. Ryan Mallory and/or SharePlanner are not licensed financial advisors, brokers, or tax professionals. The content on this site should not be considered as financial, investment, tax, or legal advice.
All information and opinions expressed herein are based on sources believed to be accurate and reliable. However, we make no representation or warranty as to their accuracy, completeness, or reliability. Any action you take upon the information on this website is strictly at your own risk.
Past performance is not indicative of future results. Investing involves risk, including the possible loss of principal. All investors should make their own decisions based on their specific investment objectives and financial circumstances.
This site may contain links to external websites that are not provided or maintained by or in any way affiliated with Ryan Mallory and/or SharePlanner. Please note that Ryan Mallory and/or SharePlanner do not guarantee the accuracy, relevance, timeliness, or completeness of any information on these external websites.
By using this website, you agree that Ryan Mallory and/or SharePlanner and any affiliated parties are not responsible for any losses or damages resulting from your use of or reliance on the information provided.
It is strongly recommended that you consult with a qualified professional before making any financial decisions.