
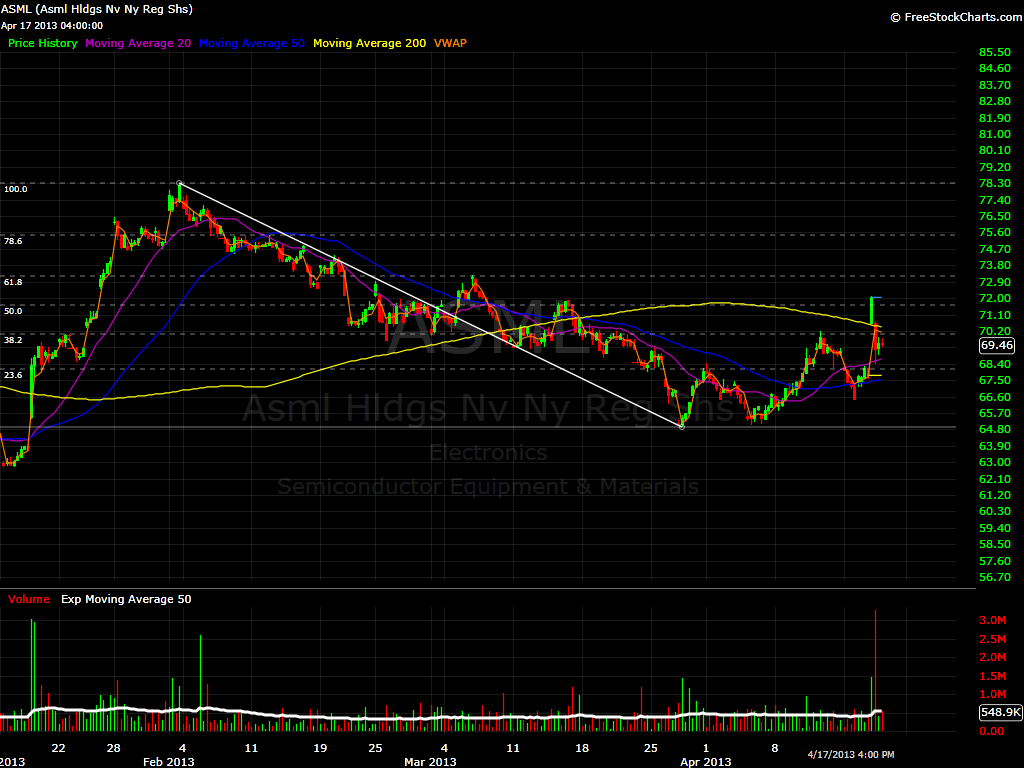
$ASML 2 Hour Chart – Doing the same thing it did yesterday. A nice gap, that most liekly will fade. Watch for 71.63 to hold. If it doesn’t, you just short it, and maybe this time, it will go all the way down to 68.10.
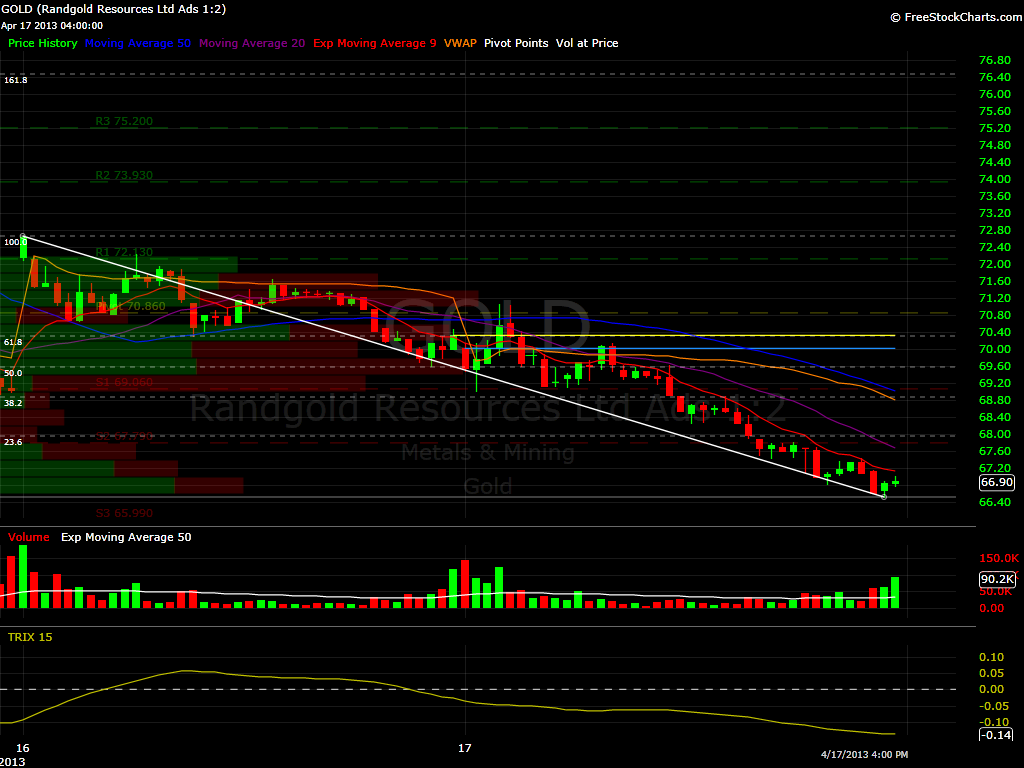
$GOLD 10 min Chart – Gaping two Fibonacci Levels, and most likely it will not hold above the 38.2% without re-testing the 23.6%, so watch for a quick short for about .90 cents if it fails to hold 68.88.
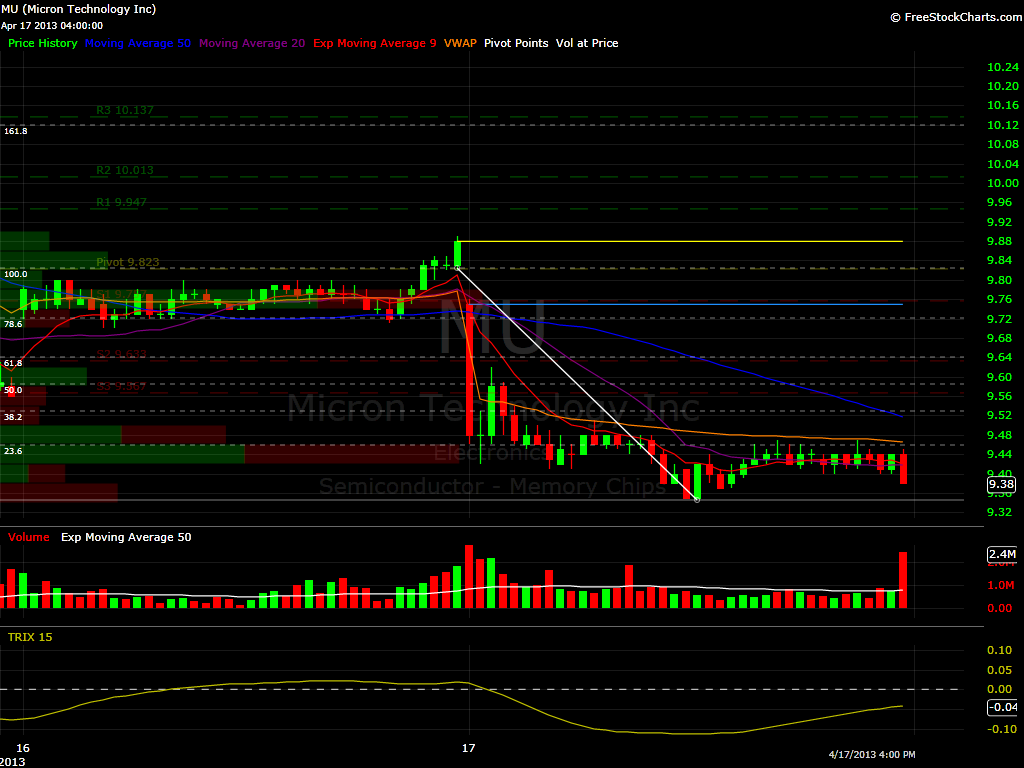
$MU 10 min – I like this setup. This one will most likely open just above the 23.6% 9.45. As long as it holds above, $MU can run to a decent 9.72+ target.
$SNDK 15 Min Chart – I don’t think it’s got that much thrust on this gap up. If it gets to touch 57.12 (78.6% Fibonacci level, I will be impressed. Pre- market shows 56.75, so 56.50 (61.8% Fibonacci Level) could be whjere it will most likely turn around.

$SVA Hourly Chart – Nice little setup, as long s it holds above 4.13, I think it goes higher. If it can reach above 4.30, it will take off to 4.50 where it might have some trouble getting over.

$TZOO Daily Chart – Another exagerated gap, that put $TZOO right at the 61.8% Fibonacci level where it will most likely turn around and resume it’s descent. 23.60 is the number it needs to hold above.

$VOD 30 min chart – 29.14 is the 61.8% Fibonacci level. These 61.*% Fibonacci level is where most stocks turn around, and the same thing is what I expect from $VOD.

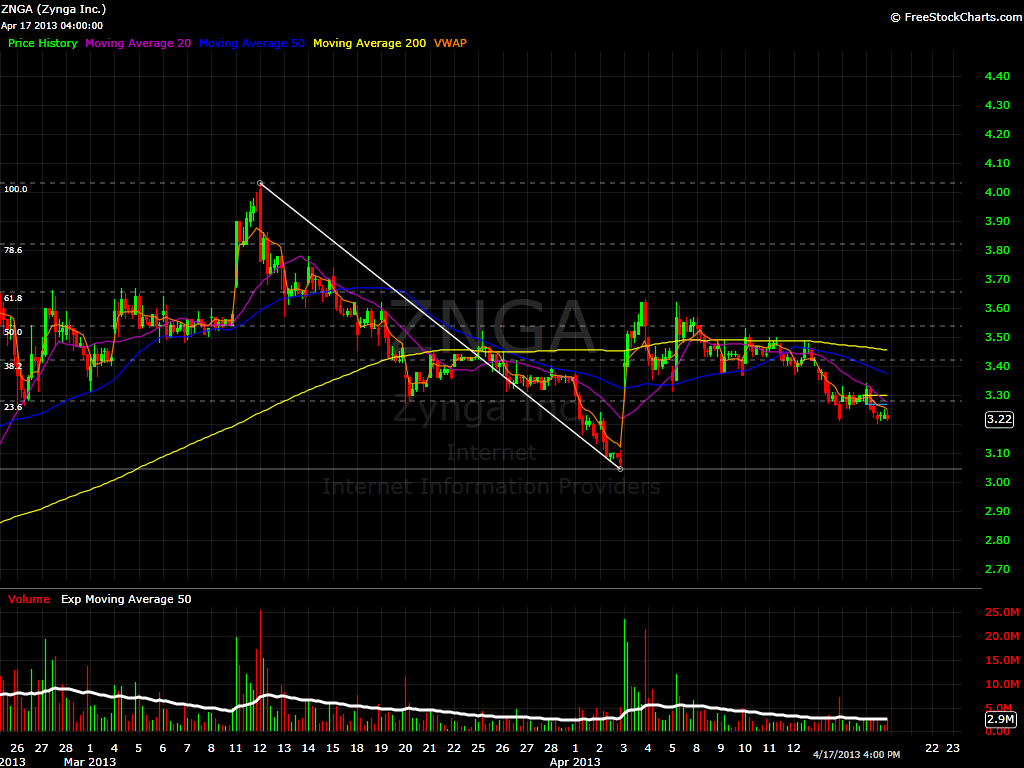
$ZNGA Hourly Chart – I decided to take a closer look in $ZNGA today. Change my Fibonacci line to something more tradeble on a daily basis. So here is my take, if it can go over 3.28, then I think it is a nice long with a 1st target of 3.42. If it closes above 3.38 (50ma on Daily Chart), then there is something left on this company.


Welcome to Swing Trading the Stock Market Podcast!
I want you to become a better trader, and you know what? You absolutely can!
Commit these three rules to memory and to your trading:
#1: Manage the RISK ALWAYS!
#2: Keep the Losses Small
#3: Do #1 & #2 and the profits will take care of themselves.
That’s right, successful swing-trading is about managing the risk, and with Swing Trading the Stock Market podcast, I encourage you to email me (ryan@shareplanner.com) your questions, and there’s a good chance I’ll make a future podcast out of your stock market related question.
Refusing to take a loss when the trade has turned, and the reason for getting into the trade in the first place is no longer valid, is one of the biggest problems traders face. In this video, Ryan Mallory discusses the pitfalls that comes with refusing to take the loss and instead opting to become a bagholder on one's trades.
Be sure to check out my Swing-Trading offering through SharePlanner that goes hand-in-hand with my podcast, offering all of the research, charts and technical analysis on the stock market and individual stocks, not to mention my personal watch-lists, reviews and regular updates on the most popular stocks, including the all-important big tech stocks. Check it out now at: https://www.shareplanner.com/premium-plans
📈 START SWING-TRADING WITH ME! 📈
Click here to subscribe: https://shareplanner.com/tradingblock
— — — — — — — — —
💻 STOCK MARKET TRAINING COURSES 💻
Click here for all of my training courses: https://www.shareplanner.com/trading-academy
– The A-Z of the Self-Made Trader –https://www.shareplanner.com/the-a-z-of-the-self-made-trader
– The Winning Watch-List — https://www.shareplanner.com/winning-watchlist
– Patterns to Profits — https://www.shareplanner.com/patterns-to-profits
– Get 1-on-1 Coaching — https://www.shareplanner.com/coaching
— — — — — — — — —
❤️ SUBSCRIBE TO MY YOUTUBE CHANNEL 📺
Click here to subscribe: https://www.youtube.com/shareplanner?sub_confirmation=1
🎧 LISTEN TO MY PODCAST 🎵
Click here to listen to my podcast: https://open.spotify.com/show/5Nn7MhTB9HJSyQ0C6bMKXI
— — — — — — — — —
💰 FREE RESOURCES 💰
— — — — — — — — —
🛠 TOOLS OF THE TRADE 🛠
Software I use (TC2000): https://bit.ly/2HBdnBm
— — — — — — — — —
📱 FOLLOW SHAREPLANNER ON SOCIAL MEDIA 📱
FACEBOOK: https://facebook.com/shareplanner
*Disclaimer: Ryan Mallory is not a financial adviser and this podcast is for entertainment purposes only. Consult your financial adviser before making any decisions.

You Might Like

South Korea: The Hidden Driver of US Tech Volatility

Stop Trying to Hit Home Runs: Start Trading Within Your Means

How to Trade Breakouts Without Getting Trapped