
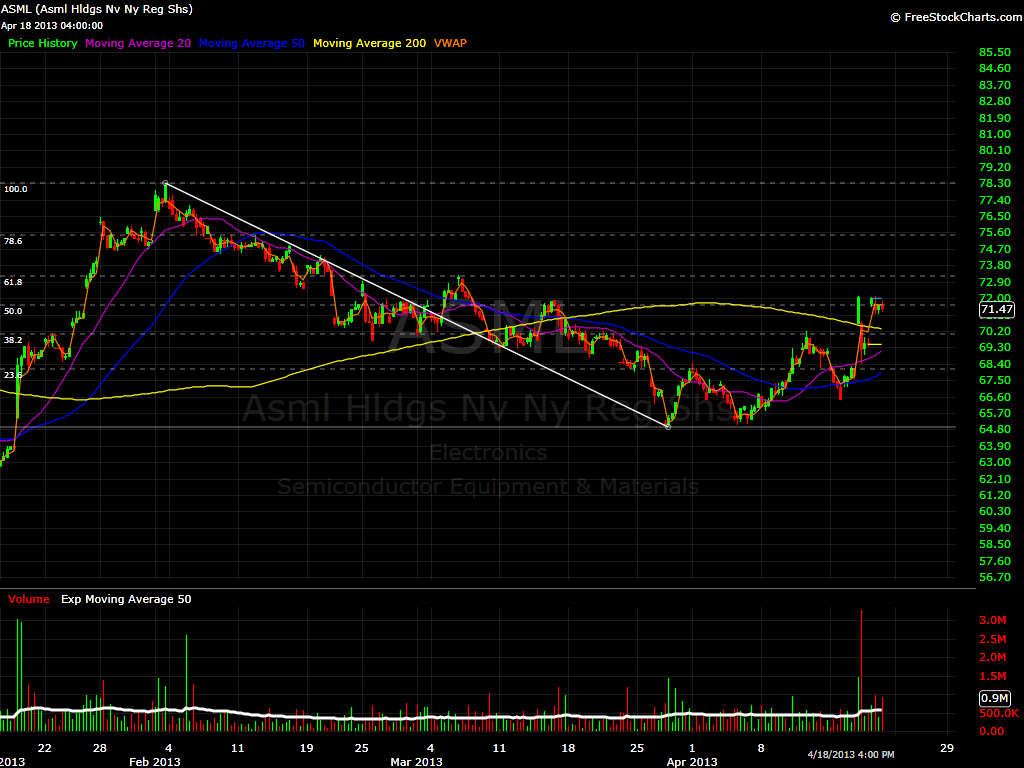
$ASML 2 Hour Chart – Gaping up, but between 2 fib levels, It looks more liekly it will go for the 73.20 target which represents the 61.8% Fibonacci level. If it does, that is usually the turning point.
$GOLD 15 min chart – Another one opening in the middle of two Fibonacci levels. I highly doubt that it can go over 73, but if it does, then 73.28 is the turning point in my opinion.

$GOOG 15 min chart – On a short term scalpers chart, $GOOG is gaping 3 Fibonacci Levels. Still far from the 50ma, so most likely it will be a pump and dump.

$MSFT 30 min chart – Good earning, gaping 3 Fibonacci levels, better hold 29.35.

$PSEC 30 min – Another gaping 2 Fib levels. This one needs to hold above 10.74.

$VOD 30 min – I will be watching this one for a double top.

$VRTX Monthly Chart – This one I had to go back a couple of years to find a good Fibonacci Level. This is not my top pick, but one that I will be curious to see what it does.

$VVUS 4 hour chart – This one is poisd for a run. This is my favorite setup. I would love to see a pullback to 12.08, before taking it for a nice ride.

$ZNGA Hourly Chart – Over 3.28 I like it.


Welcome to Swing Trading the Stock Market Podcast!
I want you to become a better trader, and you know what? You absolutely can!
Commit these three rules to memory and to your trading:
#1: Manage the RISK ALWAYS!
#2: Keep the Losses Small
#3: Do #1 & #2 and the profits will take care of themselves.
That’s right, successful swing-trading is about managing the risk, and with Swing Trading the Stock Market podcast, I encourage you to email me (ryan@shareplanner.com) your questions, and there’s a good chance I’ll make a future podcast out of your stock market related question.
In today's episode, I explain whether it is a good idea or not to rapidly increase the size of your portfolio if you come across a sum of cash. A lot of traders will do this without ever recognizing the emotional toll it can have on you as a swing trader and the awful mistakes you can make in doing so.
Be sure to check out my Swing-Trading offering through SharePlanner that goes hand-in-hand with my podcast, offering all of the research, charts and technical analysis on the stock market and individual stocks, not to mention my personal watch-lists, reviews and regular updates on the most popular stocks, including the all-important big tech stocks. Check it out now at: https://www.shareplanner.com/premium-plans
📈 START SWING-TRADING WITH ME! 📈
Click here to subscribe: https://shareplanner.com/tradingblock
— — — — — — — — —
💻 STOCK MARKET TRAINING COURSES 💻
Click here for all of my training courses: https://www.shareplanner.com/trading-academy
– The A-Z of the Self-Made Trader –https://www.shareplanner.com/the-a-z-of-the-self-made-trader
– The Winning Watch-List — https://www.shareplanner.com/winning-watchlist
– Patterns to Profits — https://www.shareplanner.com/patterns-to-profits
– Get 1-on-1 Coaching — https://www.shareplanner.com/coaching
— — — — — — — — —
❤️ SUBSCRIBE TO MY YOUTUBE CHANNEL 📺
Click here to subscribe: https://www.youtube.com/shareplanner?sub_confirmation=1
🎧 LISTEN TO MY PODCAST 🎵
Click here to listen to my podcast: https://open.spotify.com/show/5Nn7MhTB9HJSyQ0C6bMKXI
— — — — — — — — —
💰 FREE RESOURCES 💰
— — — — — — — — —
🛠 TOOLS OF THE TRADE 🛠
Software I use (TC2000): https://bit.ly/2HBdnBm
— — — — — — — — —
📱 FOLLOW SHAREPLANNER ON SOCIAL MEDIA 📱
*Disclaimer: Ryan Mallory is not a financial adviser and this podcast is for entertainment purposes only. Consult your financial adviser before making any decisions.
You Might Like

The Retail Trading Revolution: How Small Investors Are Reshaping the Stock Market

Fading the Gap: How Large Overnight Moves in SPY and QQQ Play Out During the Trading Day

How to Trade a Bear Flag