
The stock market has rallied hard in a short period of time, and that alone is not unusual. What stands out right now is what appears to be driving the move. This does not look like a broad, healthy advance led by widespread participation, steady earnings growth, or normal price discovery. Instead, the rally looks

Even if we sell-off today, there's a lot of work to do on this chart before you can get overly bearish on it again.
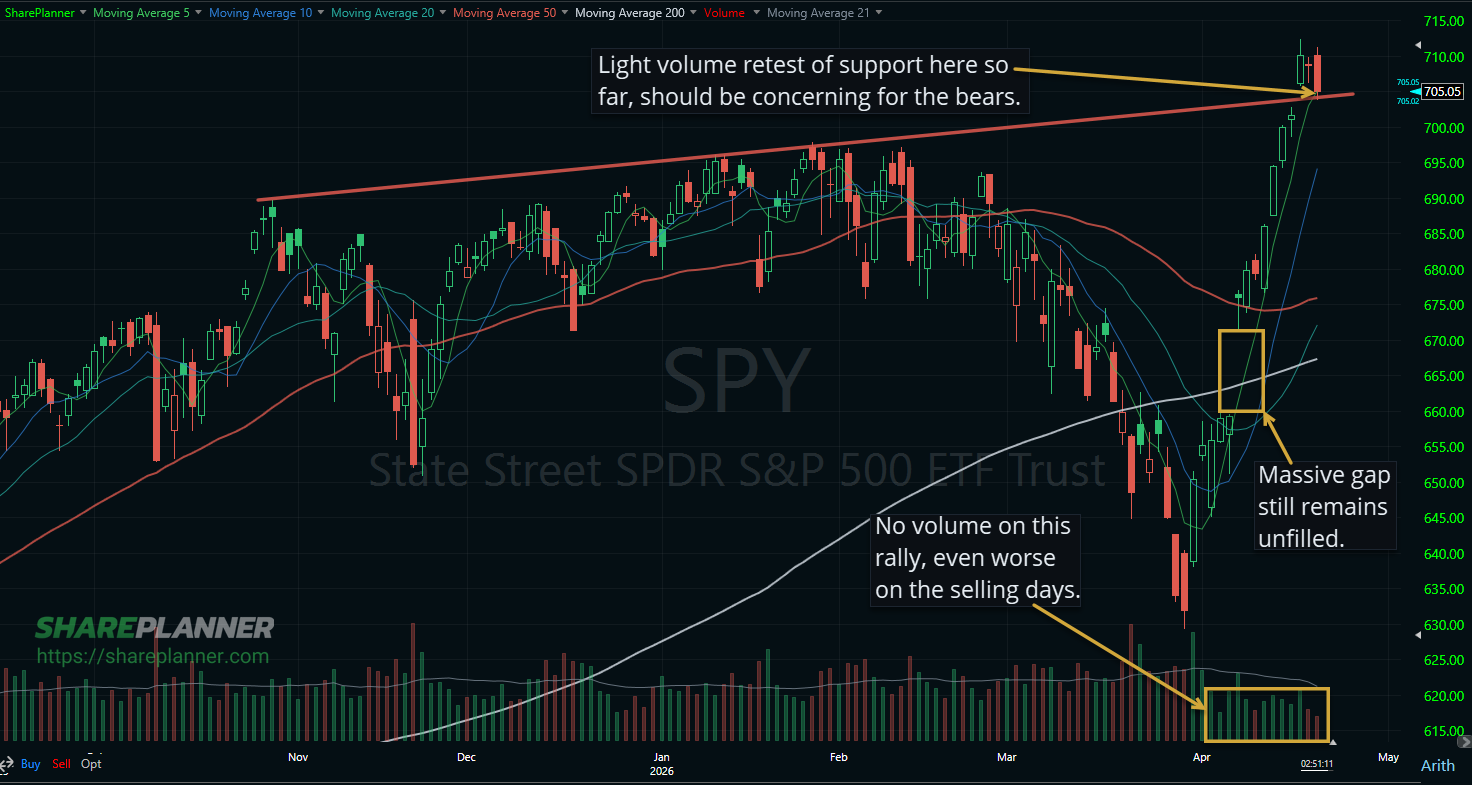
The volume on today's and yesterday's barely noticeable sell-off is extremely light, and not something I'm taking serious at this point.
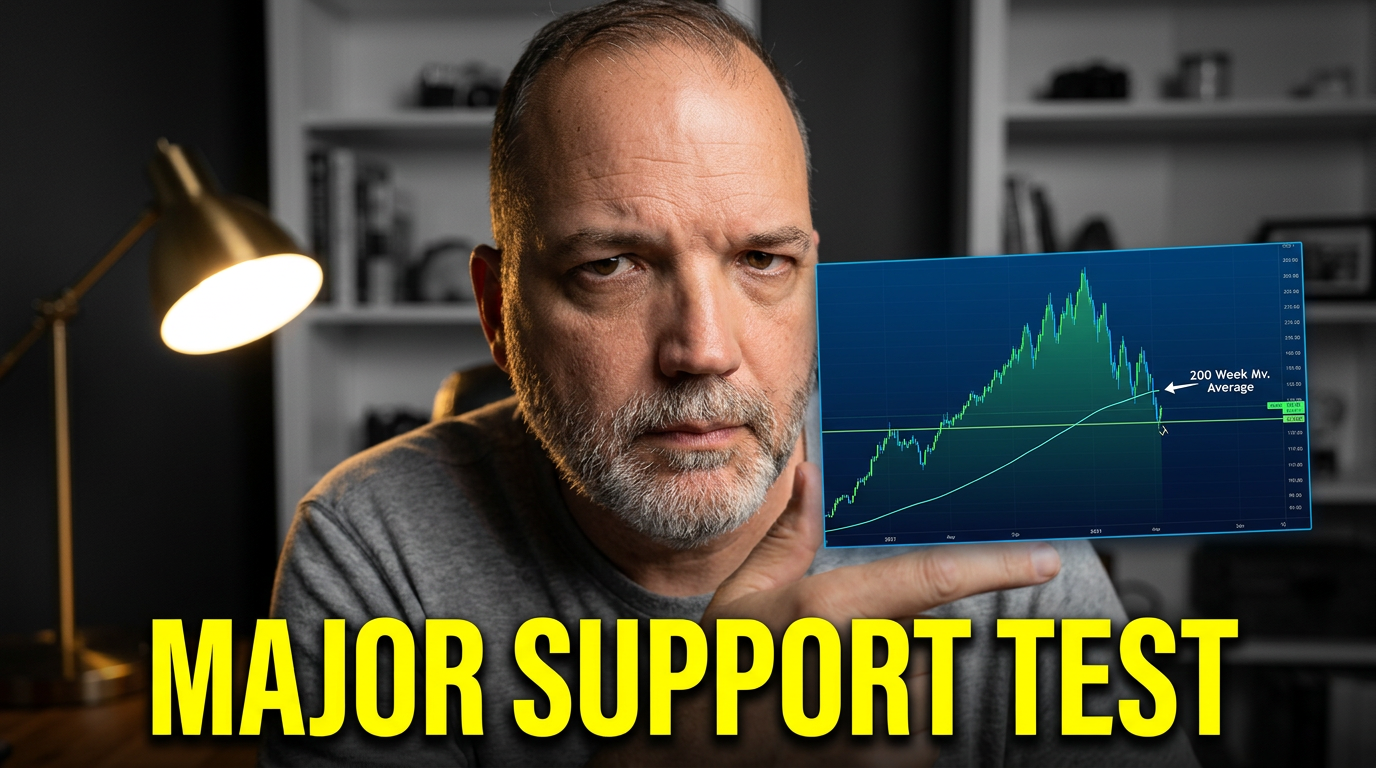
The market is currently in a correction, and SPY is showing signs of a potential bounce. But before assuming the trend is reversing, it’s critical to understand what we may actually be seeing: a counter-trend rally. These rallies happen within a larger downtrend and often mislead traders into thinking the worst is over. But the cool thing

War headlines can move markets quickly. The bigger question is whether the conflict changes earnings, inflation, rates, or recession risk. In many cases, the initial shock fades once uncertainty turns into information. When the shock does not fade, crude oil is often part of the reason. Historically, the S&P 500’s initial reaction to major geopolitical

The stock market continues to show mixed signals, with SPY, QQQ, IWM, and Oil all sending different messages, following the war outbreak in Iran. In this video, I break down the technical analysis on each of these major ETFs and crude futures, review my key market indicators, and reveal what traders can expect next as
The overall market continues to frustrate traders with choppy, directionless price action. All three major index ETFs - SPY, QQQ, and IWM - remain range-bound, making it difficult to capture momentum or follow-through in either direction. In today’s video, I dive into each chart and examine: Where major support and resistance levels are forming How
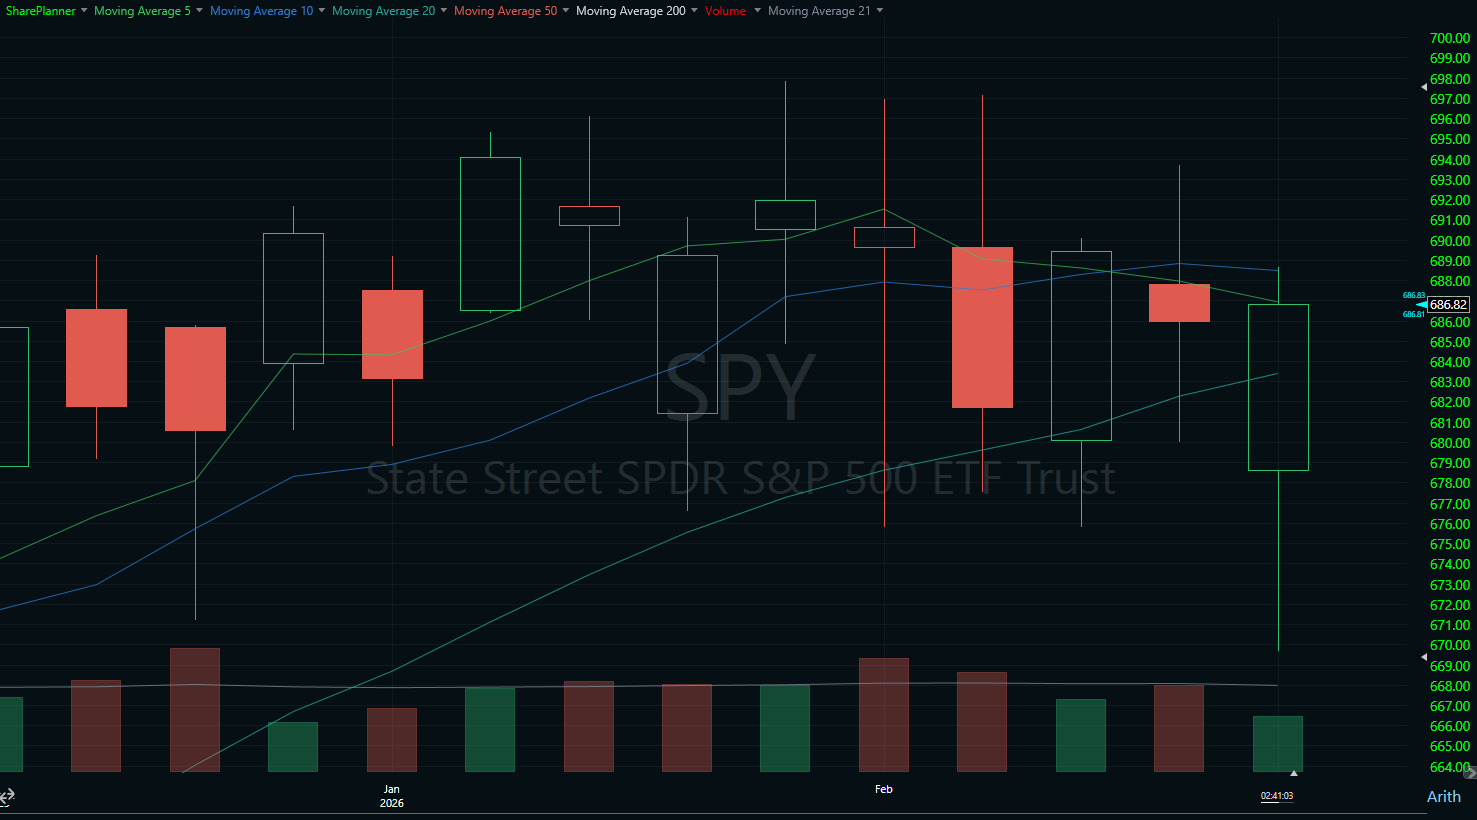
After opening deep in the red, the market saw a sharp rebound across all major indices, with S&P 500 (SPY), Nasdaq 100 (QQQ), and Russell 2000 (IWM) all bouncing off the lows, though not recovering all the losses. We've seen a number of these huge sell-offs of late lead to massive rebounds in the days
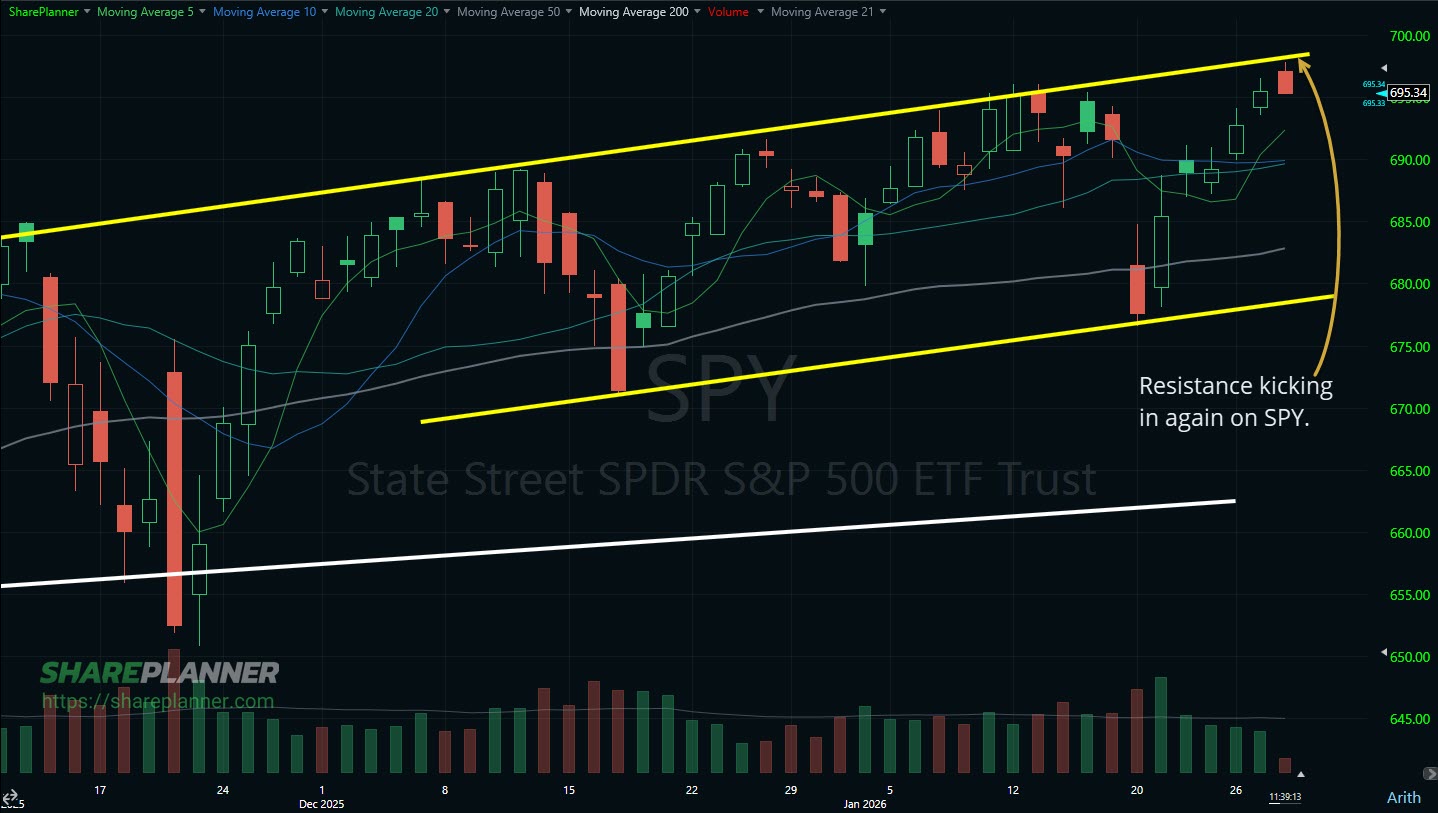
This resistance on SPY that goes back to November continues to bludgeon traders who want to get long anything not semiconductor related.

spc@shareplanner.com
(904) 800-8420
© Copyright 2025 | SharePlanner Inc. All Rights Reserved.
Disclaimer: The information provided on this website is for educational and informational purposes only. Ryan Mallory and/or SharePlanner are not licensed financial advisors, brokers, or tax professionals. The content on this site should not be considered as financial, investment, tax, or legal advice.
All information and opinions expressed herein are based on sources believed to be accurate and reliable. However, we make no representation or warranty as to their accuracy, completeness, or reliability. Any action you take upon the information on this website is strictly at your own risk.
Past performance is not indicative of future results. Investing involves risk, including the possible loss of principal. All investors should make their own decisions based on their specific investment objectives and financial circumstances.
This site may contain links to external websites that are not provided or maintained by or in any way affiliated with Ryan Mallory and/or SharePlanner. Please note that Ryan Mallory and/or SharePlanner do not guarantee the accuracy, relevance, timeliness, or completeness of any information on these external websites.
By using this website, you agree that Ryan Mallory and/or SharePlanner and any affiliated parties are not responsible for any losses or damages resulting from your use of or reliance on the information provided.
It is strongly recommended that you consult with a qualified professional before making any financial decisions.