
$ALXA 4 Hour Chart - Gaping up practically 3 Fibonacci Levels. For this move to have legs, it needs to hold above 4.74. $ARMH Daily Chart - Gaping up just above a fib level. Needs to stay above 42.37, if it doesn't then it will be a short. $ASTX 8 Day Chart - This stock

$ASTX 8 Day Chart - I like this setup, I would love to see it re-testing the 4.58 fib level, and once it crosses back above the 20ma, I think it takes off. $BBRY Daily Chart - Close to the 15.52 Fib level, I think this time it goes. If it doesn't then use 15.52

$AMRN Daily Chart - This is my kind of setup, scooping from the bottom up. As long as it holds the 7.53 level, it is an awesome long setup. $BBRY 2 day chart - Weak bounce as usual, I don't even know why it shows up so much on my screner. Above 15.52 is good,

$AAPL Daily Chart - This is a Fibonacci study focused on short term trading on $AAPL. It held the 451.42 which represents the 23.6% Fibonacci level on this particula chart. As long as it stays above this level it is a good long. First target 471.26. $BBRY Daily Chart - Posted nice earnings, but 15.52

$AIXG Daily Chart - Gaping but low volume. If it touches 15.35, and does not cross it, it could be a nice 1 dollar roll short. $BSFT 2 Hour Chart - Same thing gaping, but not that much. I want to see how it will handle the lower Fibonacci Support @ 27.72. $CETV Hourly Chart

$ARMH 2 Hour Chart - Seems to be holding well the 41 level. Gaping higher today. The gap still puts the stock in the middle of two Fibonacci Levels. $ARNA Daily Chart - Mild gap but put it very close to yesterday's highs. Could be a runner today. $BBRY Daily Chart - Talk about a
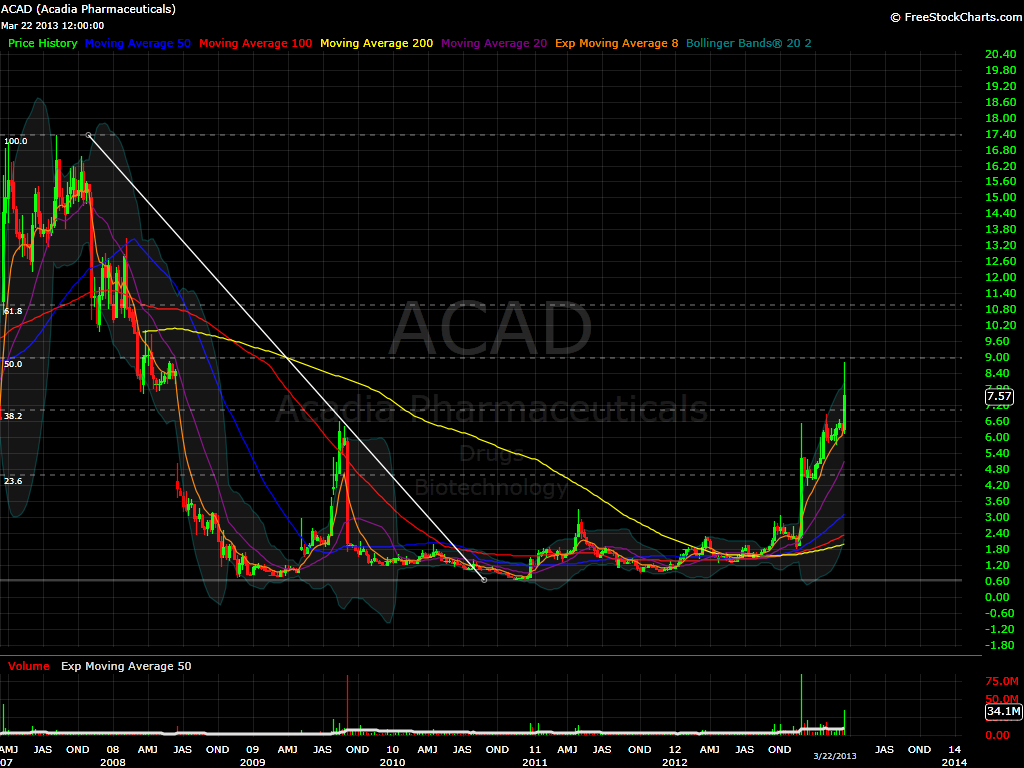
$ACAD Weekly Chart - I really thought it was going to reach it's 8.98 target last week which represents the 50% Fibonacci Level, but it did give up so close. Today it is openining high. This one should be interestingtoday. $APOL Daily Chart - Nice pop in this name. It needs to hold strong over

$ACAD Weekly Chart - This was the biggest winner from yesterday's setup. I think it is very extended here, so I will focus on how it will react once it touches the 8.98 price, which correspont to the 50% Fibonacci Level. I think it pulls back to 7.00. $ANAC Daily Chart - Gaping above the

$ACAD Weekly Chart - Sitting above the 7.03 Fibonacci level at pre-market. As long as it holds above that level it is a nice long. An idea would be to see the open, wait for the gap left behind to be filled, and once it crosses the 7.03 Fib level, one can go long with

$ARNA Daily Chart - Trying hard to move higher, but nothjng looks better than that 61.8% Fibonacci level @ 7. $BBRY Gaping above the 50% Fib level @ 15.52. If for some reason it tests that level, all I can say is. You better hold this line $RIMM lovers. $BIDU Trying hard, but still far

spc@shareplanner.com
(904) 800-8420
© Copyright 2025 | SharePlanner Inc. All Rights Reserved.
Disclaimer: The information provided on this website is for educational and informational purposes only. Ryan Mallory and/or SharePlanner are not licensed financial advisors, brokers, or tax professionals. The content on this site should not be considered as financial, investment, tax, or legal advice.
All information and opinions expressed herein are based on sources believed to be accurate and reliable. However, we make no representation or warranty as to their accuracy, completeness, or reliability. Any action you take upon the information on this website is strictly at your own risk.
Past performance is not indicative of future results. Investing involves risk, including the possible loss of principal. All investors should make their own decisions based on their specific investment objectives and financial circumstances.
This site may contain links to external websites that are not provided or maintained by or in any way affiliated with Ryan Mallory and/or SharePlanner. Please note that Ryan Mallory and/or SharePlanner do not guarantee the accuracy, relevance, timeliness, or completeness of any information on these external websites.
By using this website, you agree that Ryan Mallory and/or SharePlanner and any affiliated parties are not responsible for any losses or damages resulting from your use of or reliance on the information provided.
It is strongly recommended that you consult with a qualified professional before making any financial decisions.