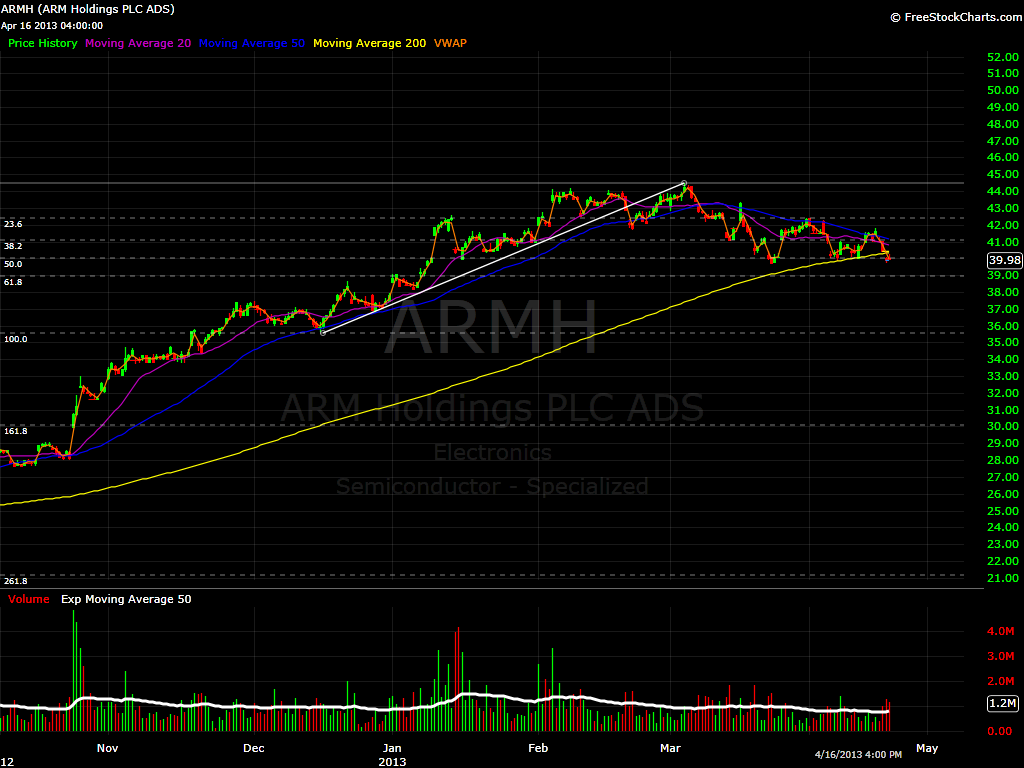
Arm Holdings (ARM) 4 Hour Chart - Insignificant gap on pre-market, most likely it will re-test 40 (50% Fibonacci Level), and nose dive to the 61.8% level represented by38.99. ASML (ASML) 2 Hour Chart - Gaping 2 Fibonacci levels at the same time. Watch for it to hold the 50% at 71.63. If
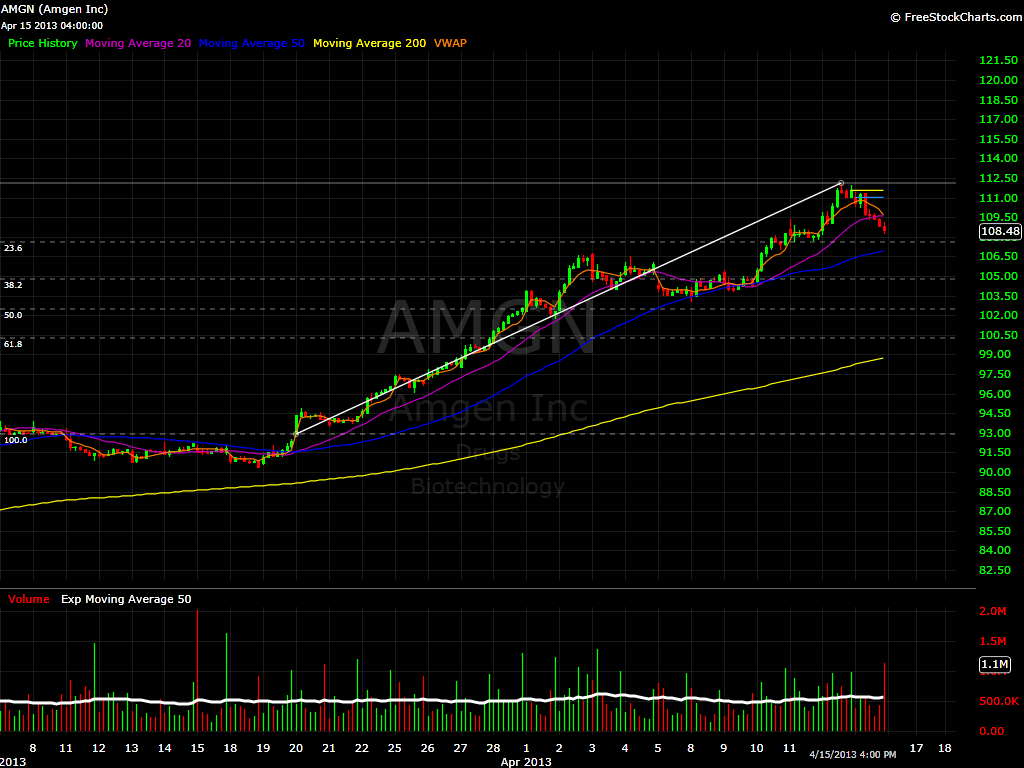
$AMGN Hourly Chart - Gaping up, this stock needs to run back and make new highs to get behind it. If at any time this name crosses under the 107.60 level, it will be a nice short. BBRY 2 Day Chart - Bounced off the 38.2% Fibonacci level 2 days ago, Looks like a good
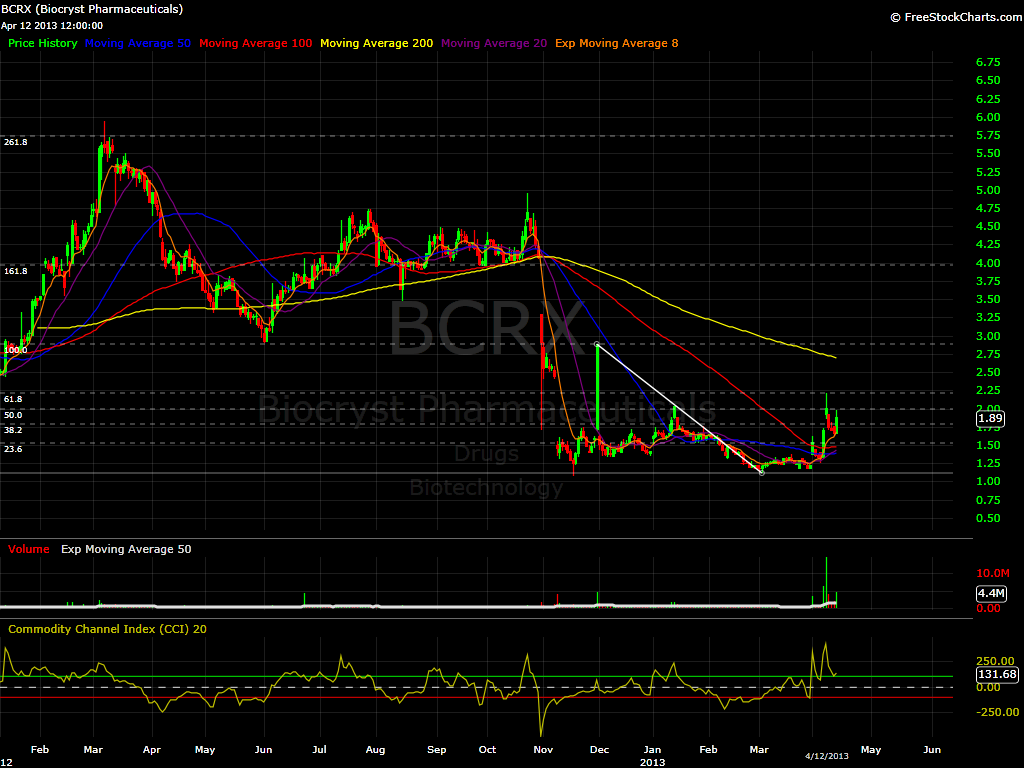
$BCRX Daily Chart - Gaping over the 50% Fibonacci Level. If it holds above, could run to 2.21 if volume comes in. $FLOW 15 min Chart - Gaping over 2 FIbonacci levels, and looking to break out higher. I would just watch the 3.74 level as the turn around point, specially with the $SPY not

$ARNA Daily Chart - Not a bad setup, it does need to cross above the 8.23 which is the 50% Fibonacci level. $BBRY 2 Day Chart - Wow sometimes I hate to be right. I got so much heat about 2 to 3 weeks ago when I started to short this stock after it did
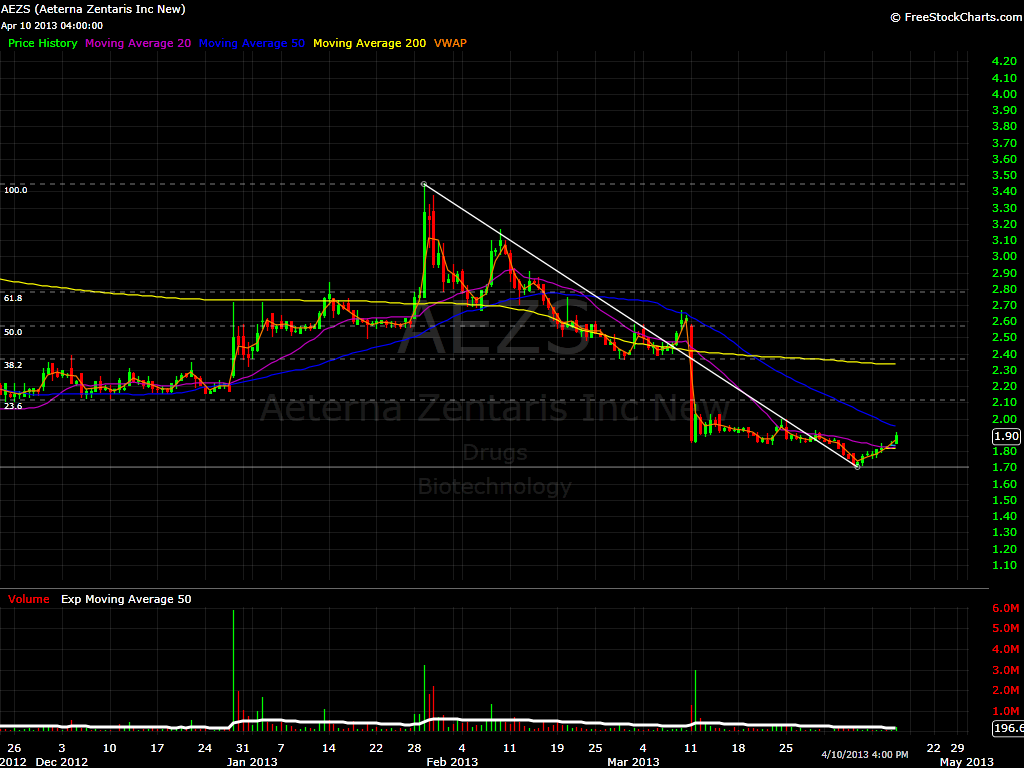
$AEZS 4 Hour chart - Nice gap up over the 23.6$ Fibonacci Level. If it holds this 2.11 price support, it will go. $AMRS Daily Chart - Gaping over the 23.6% Fibonacci Level. Needs to hold 3.16, and like $AEZS, it will go. $ASML 2 Hour Chart - Not my favorite setup, it is gaping

$BBRY Daily Chart - Always trying to make a presence on my scans, but again 15.52 is the cherry on the cake. If it does not get to that level, there is no trade long or short. $BIDU Hourly Chart - Needs to cross 86.55 to looks like a good long trade. It will most

$AAPL 15 Min Chart - I included this short term scalp chart with Fibonacci levels just in case people are looking for an entry on this stock. If it goes over 428.49 (23.6% Fibonacci Level). It is a nice long. $BBRY Daily Chart - No love until 15.52. So stop dreaming with it until then.

$AMRM Daily Chart - gaping over the 1st fib level. As long as it can hold the 7.53 level, this setup loks very bullish. $BCRX Daily Chart - Needs to hold above 2.01 which represents the 50% Fibonacci level. This could be a nice runner today. $FSLR Daily Chart - There is no setup in

$CELG 15 min - With all the market preassure, I highly doubt that $CELG will hold the 117.16 level. I think that under that level it is a good short. $FB Daily Chart - I almost shorted this one and it would eventually be a loss, but today is a different day. I will focus

$ALLT Hourly Chart - I need to see a move above 12.15 to get behind this one. $BBRY 2 Day Chart - Same old story. Until it gets over 15.52 it got nothing. $FB 2 Hour - I wanted to short this one yesterday. it worked until it touched 26 and turned back. I want

spc@shareplanner.com
(904) 800-8420
© Copyright 2025 | SharePlanner Inc. All Rights Reserved.
Disclaimer: The information provided on this website is for educational and informational purposes only. Ryan Mallory and/or SharePlanner are not licensed financial advisors, brokers, or tax professionals. The content on this site should not be considered as financial, investment, tax, or legal advice.
All information and opinions expressed herein are based on sources believed to be accurate and reliable. However, we make no representation or warranty as to their accuracy, completeness, or reliability. Any action you take upon the information on this website is strictly at your own risk.
Past performance is not indicative of future results. Investing involves risk, including the possible loss of principal. All investors should make their own decisions based on their specific investment objectives and financial circumstances.
This site may contain links to external websites that are not provided or maintained by or in any way affiliated with Ryan Mallory and/or SharePlanner. Please note that Ryan Mallory and/or SharePlanner do not guarantee the accuracy, relevance, timeliness, or completeness of any information on these external websites.
By using this website, you agree that Ryan Mallory and/or SharePlanner and any affiliated parties are not responsible for any losses or damages resulting from your use of or reliance on the information provided.
It is strongly recommended that you consult with a qualified professional before making any financial decisions.