
$AMRN 2 Hour Chart – Nice pre-market action, I would wait for it to pullback and hold 6.97 before getting serious long.

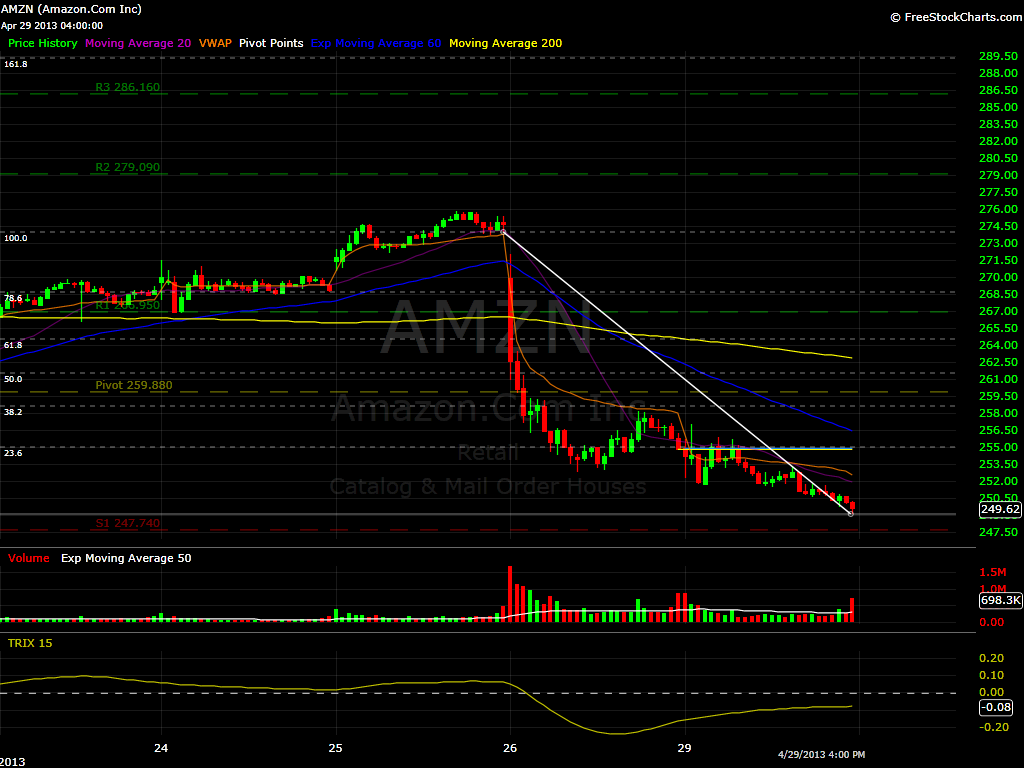
$AMZN 15 min chart – Don’t touch it until it croses 255.
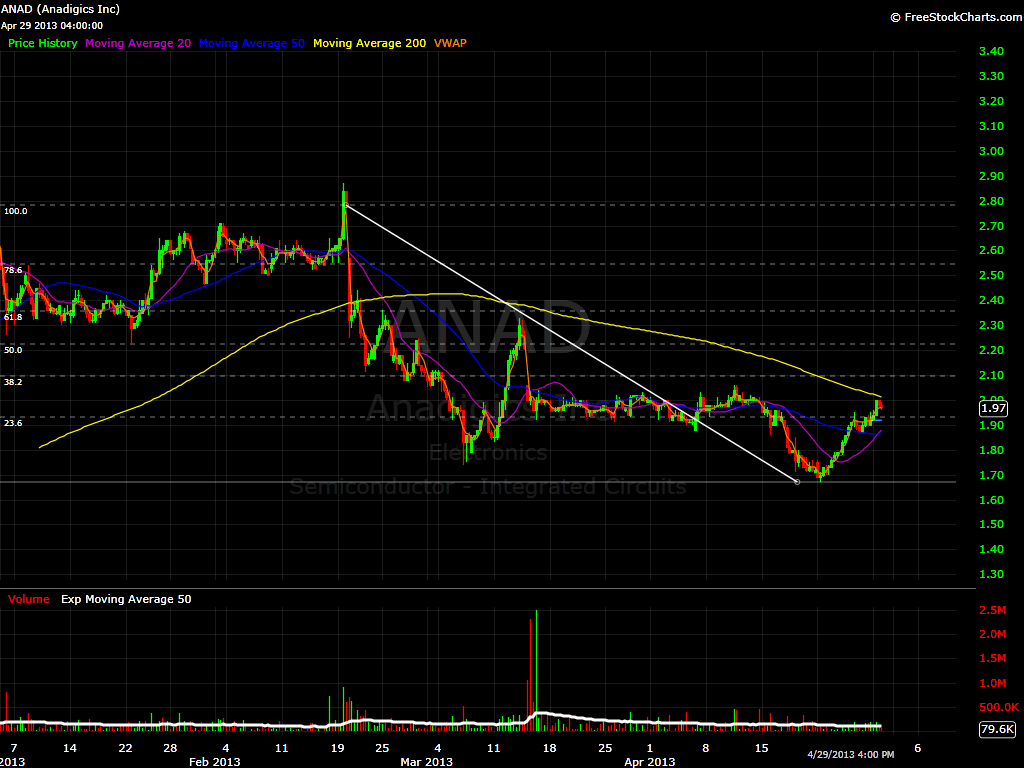
$ANAD 2 hour chart – Filling gap in pre-market, and jumping two Fibonacci levels. I would have to wait and see if it holds whichever Fibonacci level it opens above before I can look at it.
$AUXL 5 min chart – If it can stay above 14.37, there is a trade with 1st target being 14.69, then 14.96, 15.19, 15.56.

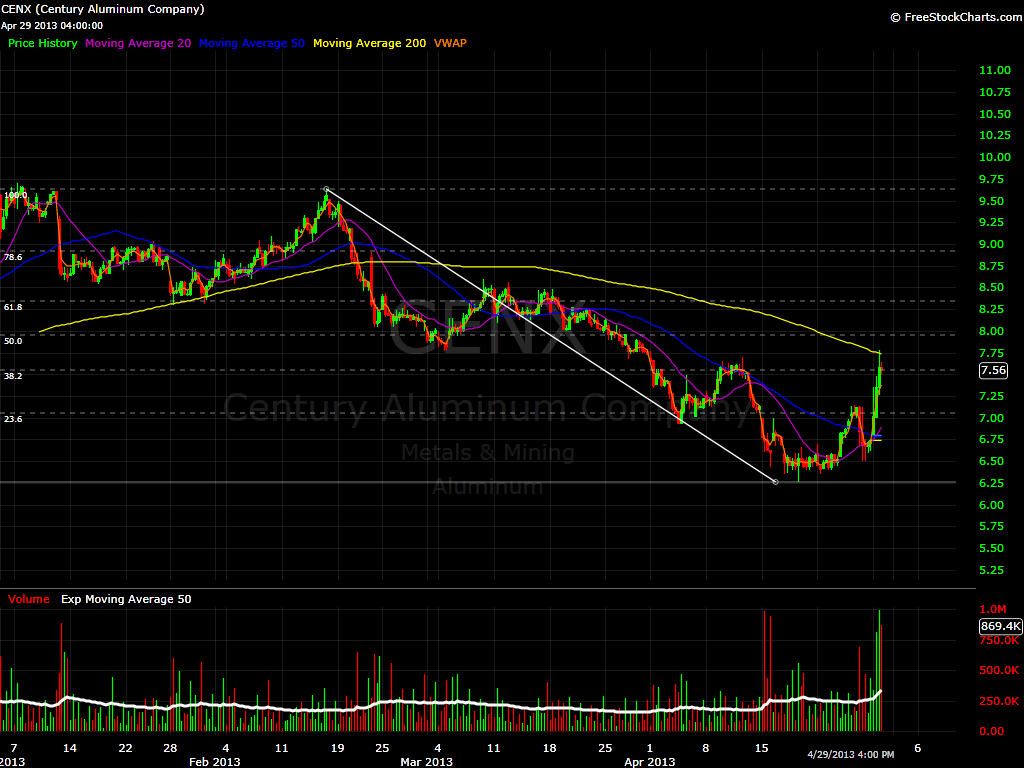
$CENX 2 hour chart – I am curious to see if it can break above 7.95
$ESRX 4 hour chart – If the market really picks up, then $ESRX will be heading to 59.83.

$RJET4 Day chart – Slow mover, but eventually with some patience it will head to 12.90.

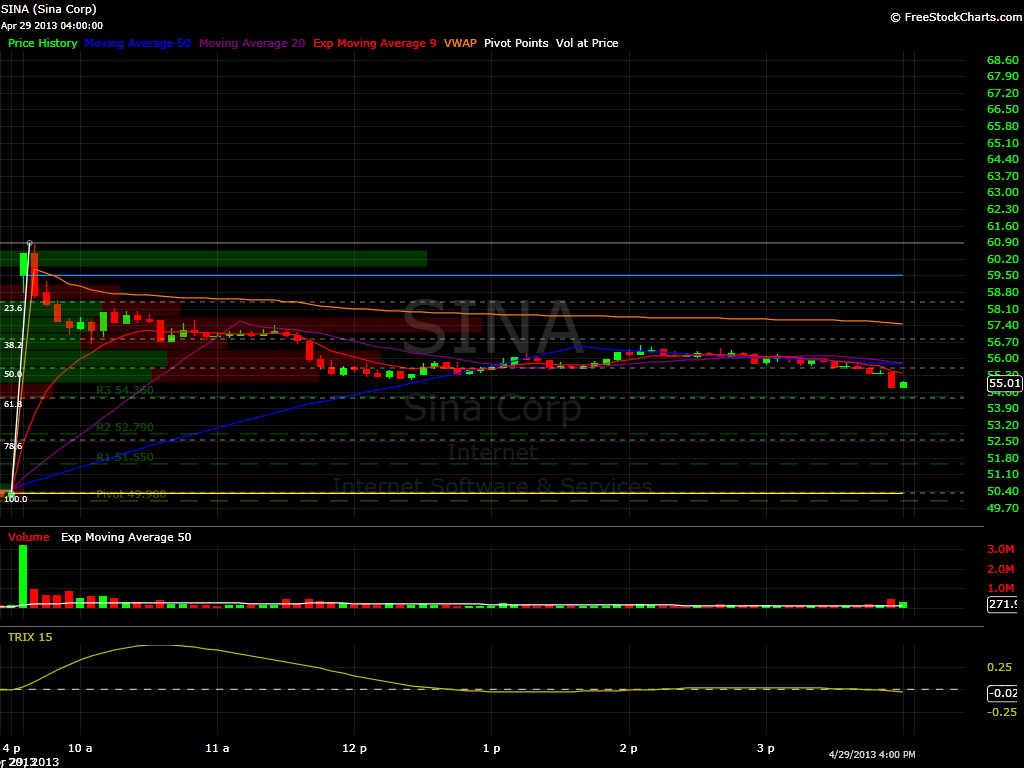
$SINA 5 min chart – Gaping above 55.60, any move under that level, and it will be a nice short.
$TTHI 2 day chart – 2.81 is the current Fibonacci support level for this nice gaper today. If it holds, then we most likely will see 3.32, 3.84, and who knows 4.56.


Welcome to Swing Trading the Stock Market Podcast!
I want you to become a better trader, and you know what? You absolutely can!
Commit these three rules to memory and to your trading:
#1: Manage the RISK ALWAYS!
#2: Keep the Losses Small
#3: Do #1 & #2 and the profits will take care of themselves.
That’s right, successful swing-trading is about managing the risk, and with Swing Trading the Stock Market podcast, I encourage you to email me (ryan@shareplanner.com) your questions, and there’s a good chance I’ll make a future podcast out of your stock market related question.
How should one go from their regular 9-5 job into full-time trading? As a swing trader, we don't have to necessarily be full-time, and instead we can combine our trading into a lifestyle that allows us to maximize our time and earning ability.
Be sure to check out my Swing-Trading offering through SharePlanner that goes hand-in-hand with my podcast, offering all of the research, charts and technical analysis on the stock market and individual stocks, not to mention my personal watch-lists, reviews and regular updates on the most popular stocks, including the all-important big tech stocks. Check it out now at: https://www.shareplanner.com/premium-plans
📈 START SWING-TRADING WITH ME! 📈
Click here to subscribe: https://shareplanner.com/tradingblock
— — — — — — — — —
💻 STOCK MARKET TRAINING COURSES 💻
Click here for all of my training courses: https://www.shareplanner.com/trading-academy
– The A-Z of the Self-Made Trader –https://www.shareplanner.com/the-a-z-of-the-self-made-trader
– The Winning Watch-List — https://www.shareplanner.com/winning-watchlist
– Patterns to Profits — https://www.shareplanner.com/patterns-to-profits
– Get 1-on-1 Coaching — https://www.shareplanner.com/coaching
— — — — — — — — —
❤️ SUBSCRIBE TO MY YOUTUBE CHANNEL 📺
Click here to subscribe: https://www.youtube.com/shareplanner?sub_confirmation=1
🎧 LISTEN TO MY PODCAST 🎵
Click here to listen to my podcast: https://open.spotify.com/show/5Nn7MhTB9HJSyQ0C6bMKXI
— — — — — — — — —
💰 FREE RESOURCES 💰
— — — — — — — — —
🛠 TOOLS OF THE TRADE 🛠
Software I use (TC2000): https://bit.ly/2HBdnBm
— — — — — — — — —
📱 FOLLOW SHAREPLANNER ON SOCIAL MEDIA 📱
*Disclaimer: Ryan Mallory is not a financial adviser and this podcast is for entertainment purposes only. Consult your financial adviser before making any decisions.
You Might Like

The Retail Trading Revolution: How Small Investors Are Reshaping the Stock Market

Fading the Gap: How Large Overnight Moves in SPY and QQQ Play Out During the Trading Day

How to Trade a Bear Flag