
$BBRY Daily Chart - There is only one spot that I can embrace $BBRY and that is above 15.52, until then, it is a no go for me. $DELL Daily Chart - Have ran a lot lately, I think a pullback is needed. That should start to happen once it reaches the 14.67 level. $EA

$AMZN Hourly Chart - Opening above the 261.81 Fibonacci Level, but a lot of selling going this morning. If it gets close to that level, and doesn't hold, one can short this baby down. $ARMH Hourly Chart - Gaping over the 42.18 Fib level. It did the same thing last week, and I believe the
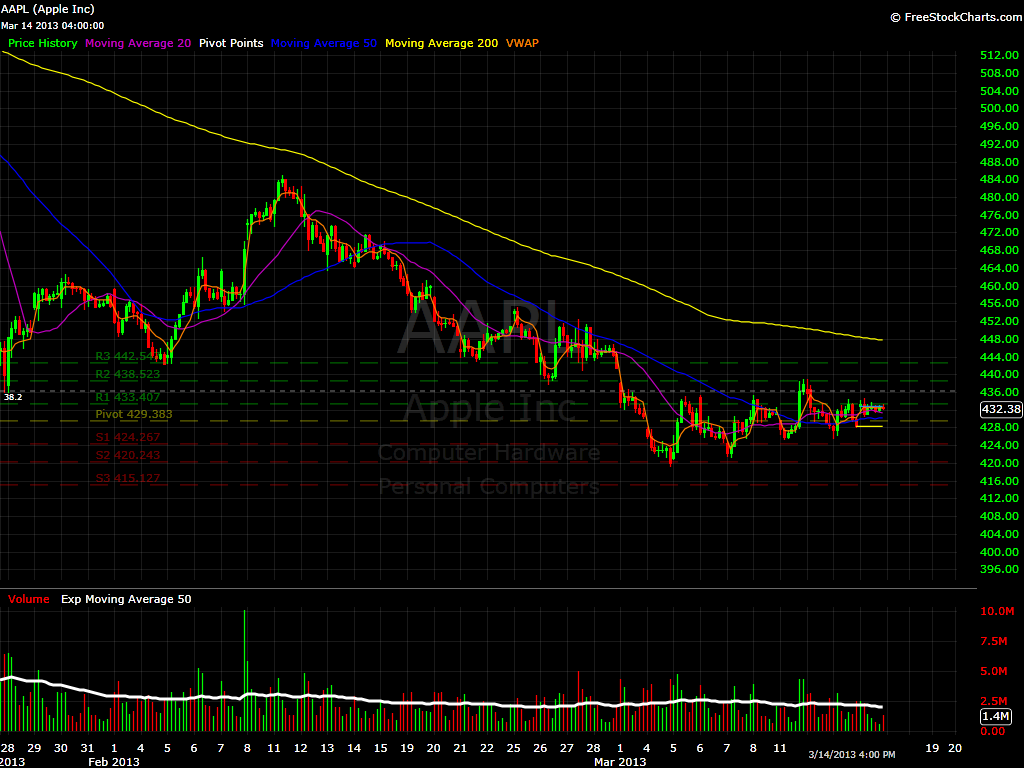
$AAPL Horuly chart - Opening above the 38.2% Fibonacci retracement, as long as it stays above the 436.20 level, it is good to go. $ARMH Daily Chart - Opening above the 23.6 Fibonacci Level. And looking very much to break new highs. $ASMI 15 min chart - Opening above the 23.6% Fibonacci level, as long

$AAPL Daily chart - I have no idea how it showed up on my scans today, but here is the deal. 436.30 is the current resistance level. I think that everytime it touches that level it will sell. Above it with some serious volume, and maybe it has a good chance. $AFFY 15 min chart

$ASML daily chart - trying to pop this morning, but the downside is pretty much inevitable. If it starts to fail to move higher, One can short it under 69.25. The 1st target is the 38.2% Fibonmacci level. If market gets voracious and continue to sell it will break that level, and the following target

$BBRY Daily Chart - Watch for the 15.50 level. It could take off from there or find some decent resistance. $GLUU Daily Chart - Gaping nicely, I will be watching the 3.07 level, if it breaks, then this one can continue to explode. $GOLD Hourly Chart - 82.60 is where things really start to happen,
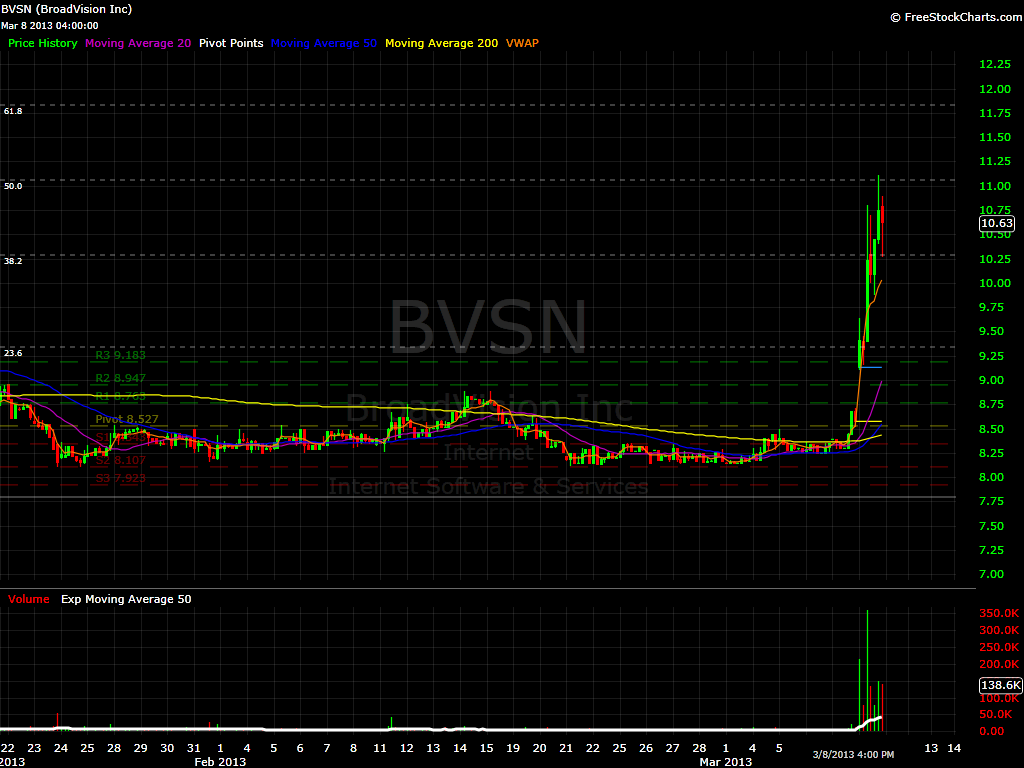
$BVSN Hourly Chart - Looking to open above 11 which is Fibonacci Level. If we have any kind of stremgth, watch this pop fast to 11.84 where it should ultimately fail, and drop back to 11 or lower. $CIEN Weekly Chart - Watch for this stock to open under 17.11. I think it is a

$AGNC I am looking to see thi sone briefly re-test the 32.42 Fibonacci level, and then it can take off again. $BBRY I can't take it until it crosses the 13.71 level. $CIEN It had a better entry yesterday, but it still show a lot of potential. $GLUU looks good, but I still thinkit will

$ARCP Interesting gap, I would like to see it hold the 13.91 fib level before it takes off to new highs. $BBRY If it can reach 13.71, that is where I want to see it pushing through. If it can't take that level, then it will be a short to 12.30. Enough is enough. $CIEN
-
$ARCP Interesting gap, I would like to see it hold the 13.91 fib level before it takes off to new highs. $BBRY If it can reach 13.71, that is where I want to see it pushing through. If it can't take that level, then it will be a short to 12.30. Enough is enough. $CIEN

spc@shareplanner.com
(904) 800-8420
© Copyright 2025 | SharePlanner Inc. All Rights Reserved.
Disclaimer: The information provided on this website is for educational and informational purposes only. Ryan Mallory and/or SharePlanner are not licensed financial advisors, brokers, or tax professionals. The content on this site should not be considered as financial, investment, tax, or legal advice.
All information and opinions expressed herein are based on sources believed to be accurate and reliable. However, we make no representation or warranty as to their accuracy, completeness, or reliability. Any action you take upon the information on this website is strictly at your own risk.
Past performance is not indicative of future results. Investing involves risk, including the possible loss of principal. All investors should make their own decisions based on their specific investment objectives and financial circumstances.
This site may contain links to external websites that are not provided or maintained by or in any way affiliated with Ryan Mallory and/or SharePlanner. Please note that Ryan Mallory and/or SharePlanner do not guarantee the accuracy, relevance, timeliness, or completeness of any information on these external websites.
By using this website, you agree that Ryan Mallory and/or SharePlanner and any affiliated parties are not responsible for any losses or damages resulting from your use of or reliance on the information provided.
It is strongly recommended that you consult with a qualified professional before making any financial decisions.