
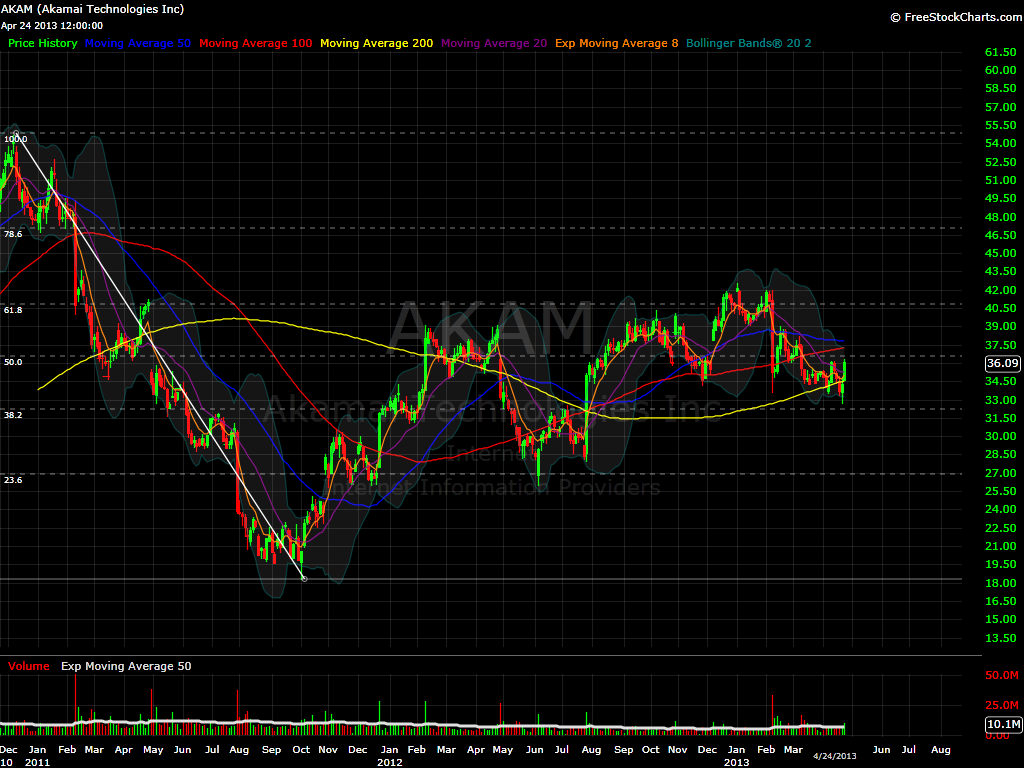
$AKAM 2 Day Chart – Nice pop after earnings, Opening betwen 2 Fibonacci levels, I think it goes higher, but it should pullback and hold the 40.88. If it does, and the market is still strong, then it may continue higher, maybe even a good swing overnight, with target at 47.
$ALXN 15 min chart – 91.69 correspond to the 23.6% Fibonacci level. That for me is the launch pad, so if it can stay above that level it will go.

$BIIB 5 min Chart – Gaping over 2 Fibonacci levels. If it holds 211.85 (50% Fibonacci Level) it can run another 2 dollars.

$CROX 4 Hour Chart – If it holds 16.10 (61.8% Fibonacci Level) It can run to 17.20.

$INFN 2 Day Chart – Watch 7.76, if it holds, then it will reach 8.55+.

$LSI 2 Hour Chart – Hold 6.39 (23.6% Fibonacci Level), then it is on the launch pad, and ready to take off.

$PERI 2 Hour Chart – I personally thinks it is a bit extended specially because it is about to touch the 78.6% Fibonacci Level, but with the market so strong, and if it can hold 12.07, then I do believe it goes hogher.

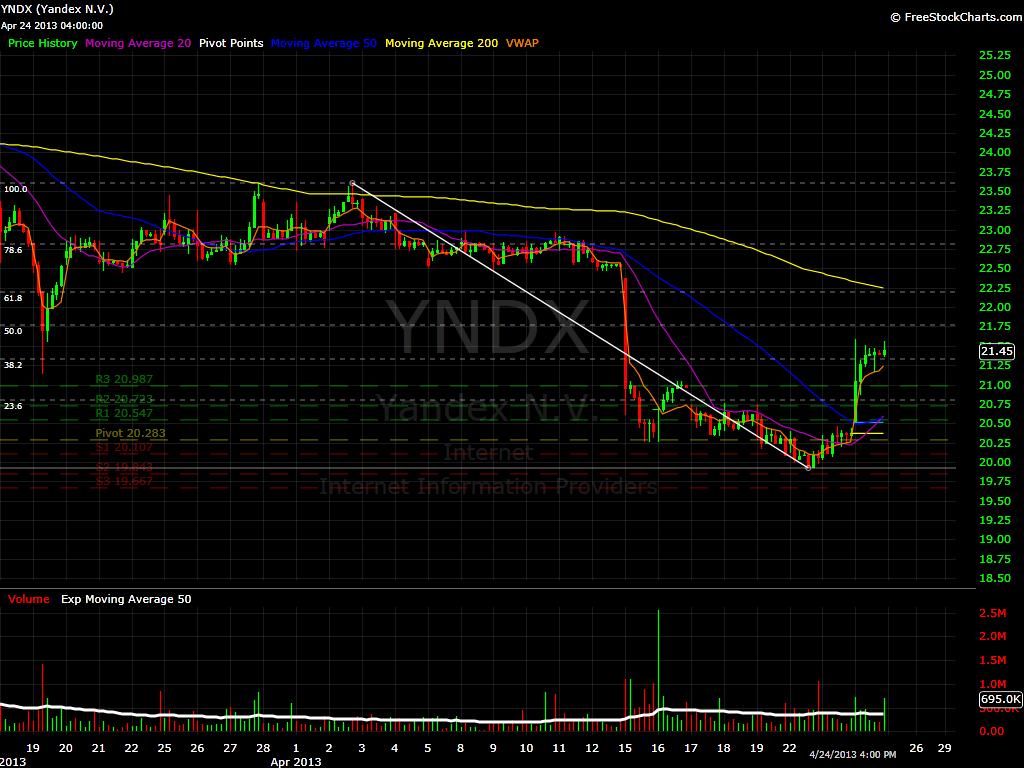
$YNDX Hourly Chart – This is not my favorite chart, I decided to draw the line anyway, but as you can see it is a very tight range. 22.82 is the number I need to see $YNDX hold. Not sure it will.

Welcome to Swing Trading the Stock Market Podcast!
I want you to become a better trader, and you know what? You absolutely can!
Commit these three rules to memory and to your trading:
#1: Manage the RISK ALWAYS!
#2: Keep the Losses Small
#3: Do #1 & #2 and the profits will take care of themselves.
That’s right, successful swing-trading is about managing the risk, and with Swing Trading the Stock Market podcast, I encourage you to email me (ryan@shareplanner.com) your questions, and there’s a good chance I’ll make a future podcast out of your stock market related question.
In today's episode, I cover the expectations that we should be setting for ourselves as swing traders, from the number of trades we should be expecting to take, how long and how short we should be in our trading portfolio, as well as what the expectations for a win-rate should be.
Be sure to check out my Swing-Trading offering through SharePlanner that goes hand-in-hand with my podcast, offering all of the research, charts and technical analysis on the stock market and individual stocks, not to mention my personal watch-lists, reviews and regular updates on the most popular stocks, including the all-important big tech stocks. Check it out now at: https://www.shareplanner.com/premium-plans
📈 START SWING-TRADING WITH ME! 📈
Click here to subscribe: https://shareplanner.com/tradingblock
— — — — — — — — —
💻 STOCK MARKET TRAINING COURSES 💻
Click here for all of my training courses: https://www.shareplanner.com/trading-academy
– The A-Z of the Self-Made Trader –https://www.shareplanner.com/the-a-z-of-the-self-made-trader
– The Winning Watch-List — https://www.shareplanner.com/winning-watchlist
– Patterns to Profits — https://www.shareplanner.com/patterns-to-profits
– Get 1-on-1 Coaching — https://www.shareplanner.com/coaching
— — — — — — — — —
❤️ SUBSCRIBE TO MY YOUTUBE CHANNEL 📺
Click here to subscribe: https://www.youtube.com/shareplanner?sub_confirmation=1
🎧 LISTEN TO MY PODCAST 🎵
Click here to listen to my podcast: https://open.spotify.com/show/5Nn7MhTB9HJSyQ0C6bMKXI
— — — — — — — — —
💰 FREE RESOURCES 💰
My Website: https://shareplanner.com
— — — — — — — — —
🛠 TOOLS OF THE TRADE 🛠
Software I use (TC2000): https://bit.ly/2HBdnBm
— — — — — — — — —
📱 FOLLOW SHAREPLANNER ON SOCIAL MEDIA 📱
*Disclaimer: Ryan Mallory is not a financial adviser and this podcast is for entertainment purposes only. Consult your financial adviser before making any decisions.

You Might Like

Fading the Gap: How Large Overnight Moves in SPY and QQQ Play Out During the Trading Day

How to Trade a Bear Flag
Technical Analysis vs Market Conditions: How to Know What’s Affecting Your Trades