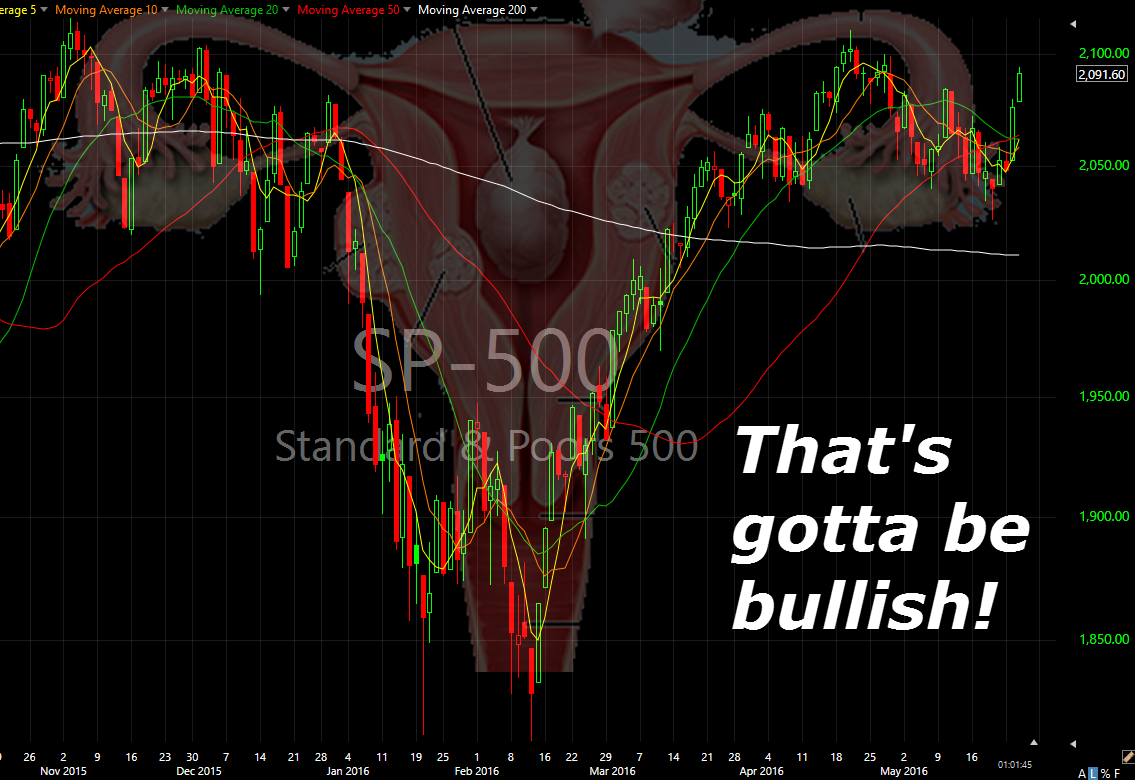
Yes, by some accounts, people will say this is a major inverse head and shoulders pattern. I disagree, what I believe this equates to is the ultra bullish female liberation breakout pattern that resembles, of course, the female anatomy. When I saw the chart, I couldn’t help but notice the obvious, and it helps to

No doubt about it, this market has become a full-fledged, Rick James, Super-Freak. The S&P 500 sells off for three straight weeks, and in one day, with one rally, the S&P 500 wipes out 2/3’s of those losses. I can’t explain it, I just embrace it. I was short coming into the morning, I am

Is it a top in oil? Maybe. Maybe not. What I do know is that USO (United States Oil Fund for those wondering) is having a horrible time trying to push through the 200-day moving average. If you look, at the weekly chart, this commodity has surged higher and since the February bottoms, and hardly
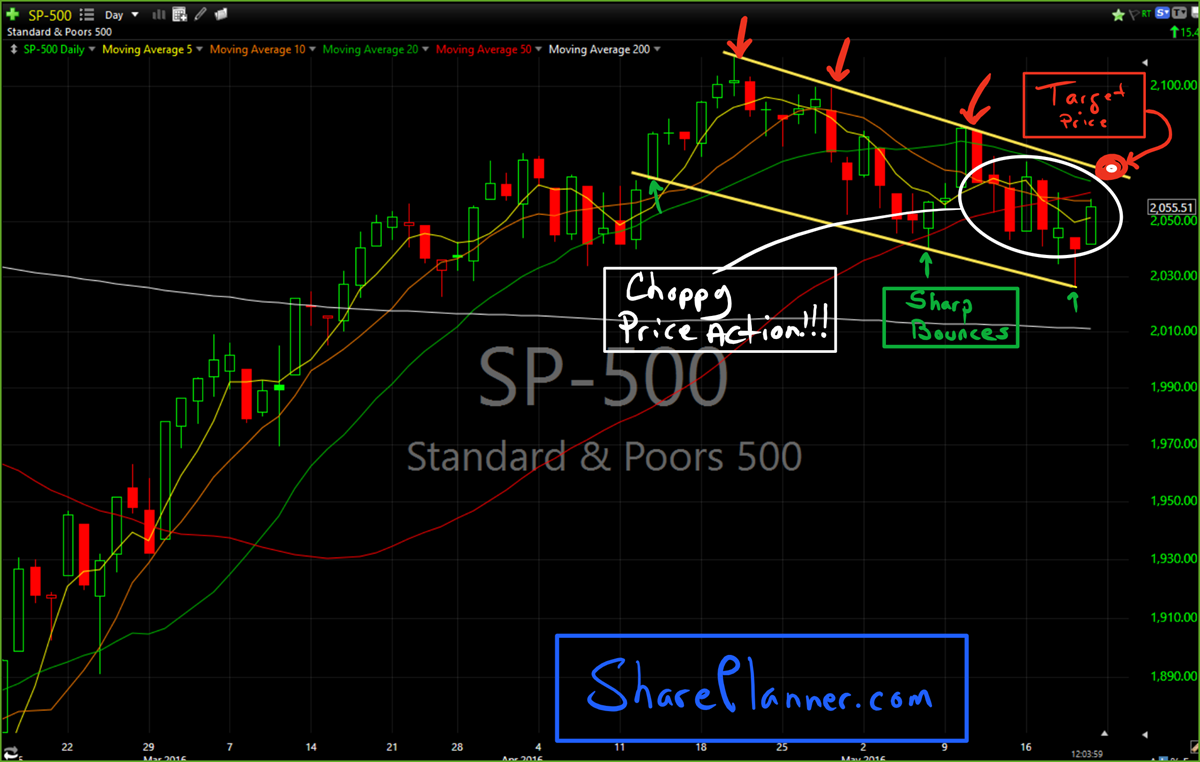
S&P 500 as of yesterday, formed a very nicely constructed and perfectly parallel price channel with the slightest of declines. In light of this new development on SPX, it is no wonder that the market is bouncing hard today.

If you traded today, you tired, frustrated, disheveled or upset that the market didn’t do what it was you wanted it to do. And when it comes to trading successfully in the stock market, that isn’t a very good trait to be holding on to. Try not to blame the market – as being one
Up until late April the market was on one incredible rally. Day after day, week after week, all stocks could do was go up, up, up. We even saw the market get within 27 points – less than 2% – from establishing new all-time highs. But now, “Sell in May, Go Away” is picking up
I came across this stock today in my scans and my gosh, it could be the single worst and most bearish stock chart out there right now. It is Bank of the Ozarks (OZRK) and it is U to the G to the L to the Y, UGLY. Here it is on the daily chart:
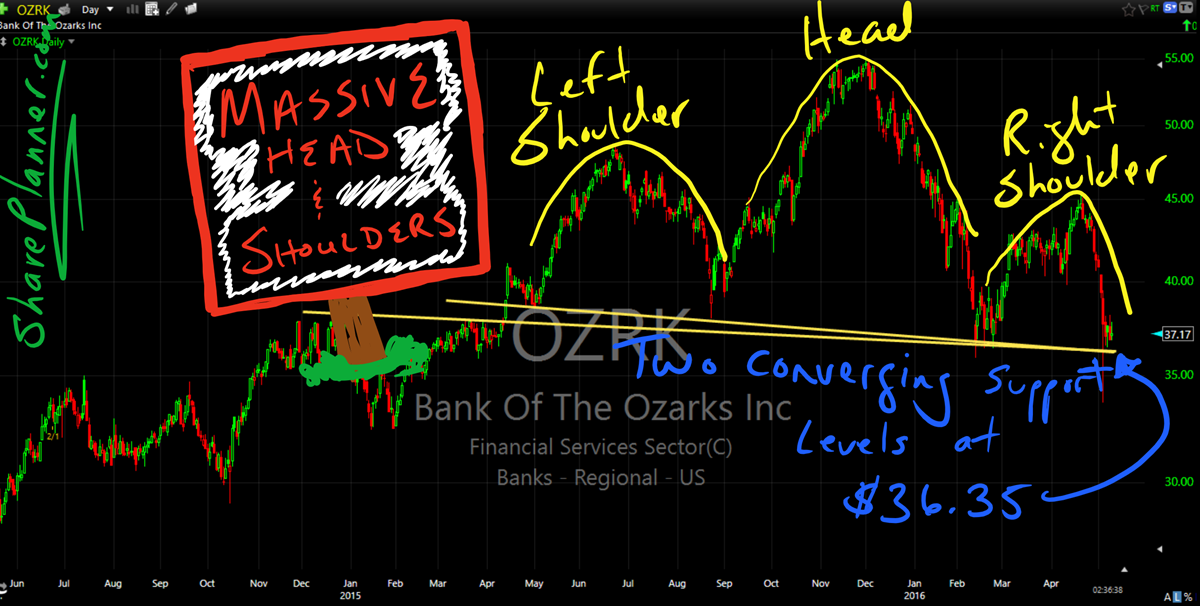
I came across this stock today in my scans and my gosh, it could be the single worst and most bearish stock chart out there right now. It is Bank of the Ozarks (OZRK) and it is U to the G to the L to the Y, UGLY. Here it is on the daily chart:

Do Emotions Help Traders? A Surprising Perspective In the world of stock market trading, conventional wisdom often suggests that emotions are a trader’s worst enemy. But do emotions help trader’s success, or do they hinder a trader as tradition would have us believe? My goal with this article is to challenge the popular notion


spc@shareplanner.com
(904) 800-8420
© Copyright 2025 | SharePlanner Inc. All Rights Reserved.
Disclaimer: The information provided on this website is for educational and informational purposes only. Ryan Mallory and/or SharePlanner are not licensed financial advisors, brokers, or tax professionals. The content on this site should not be considered as financial, investment, tax, or legal advice.
All information and opinions expressed herein are based on sources believed to be accurate and reliable. However, we make no representation or warranty as to their accuracy, completeness, or reliability. Any action you take upon the information on this website is strictly at your own risk.
Past performance is not indicative of future results. Investing involves risk, including the possible loss of principal. All investors should make their own decisions based on their specific investment objectives and financial circumstances.
This site may contain links to external websites that are not provided or maintained by or in any way affiliated with Ryan Mallory and/or SharePlanner. Please note that Ryan Mallory and/or SharePlanner do not guarantee the accuracy, relevance, timeliness, or completeness of any information on these external websites.
By using this website, you agree that Ryan Mallory and/or SharePlanner and any affiliated parties are not responsible for any losses or damages resulting from your use of or reliance on the information provided.
It is strongly recommended that you consult with a qualified professional before making any financial decisions.