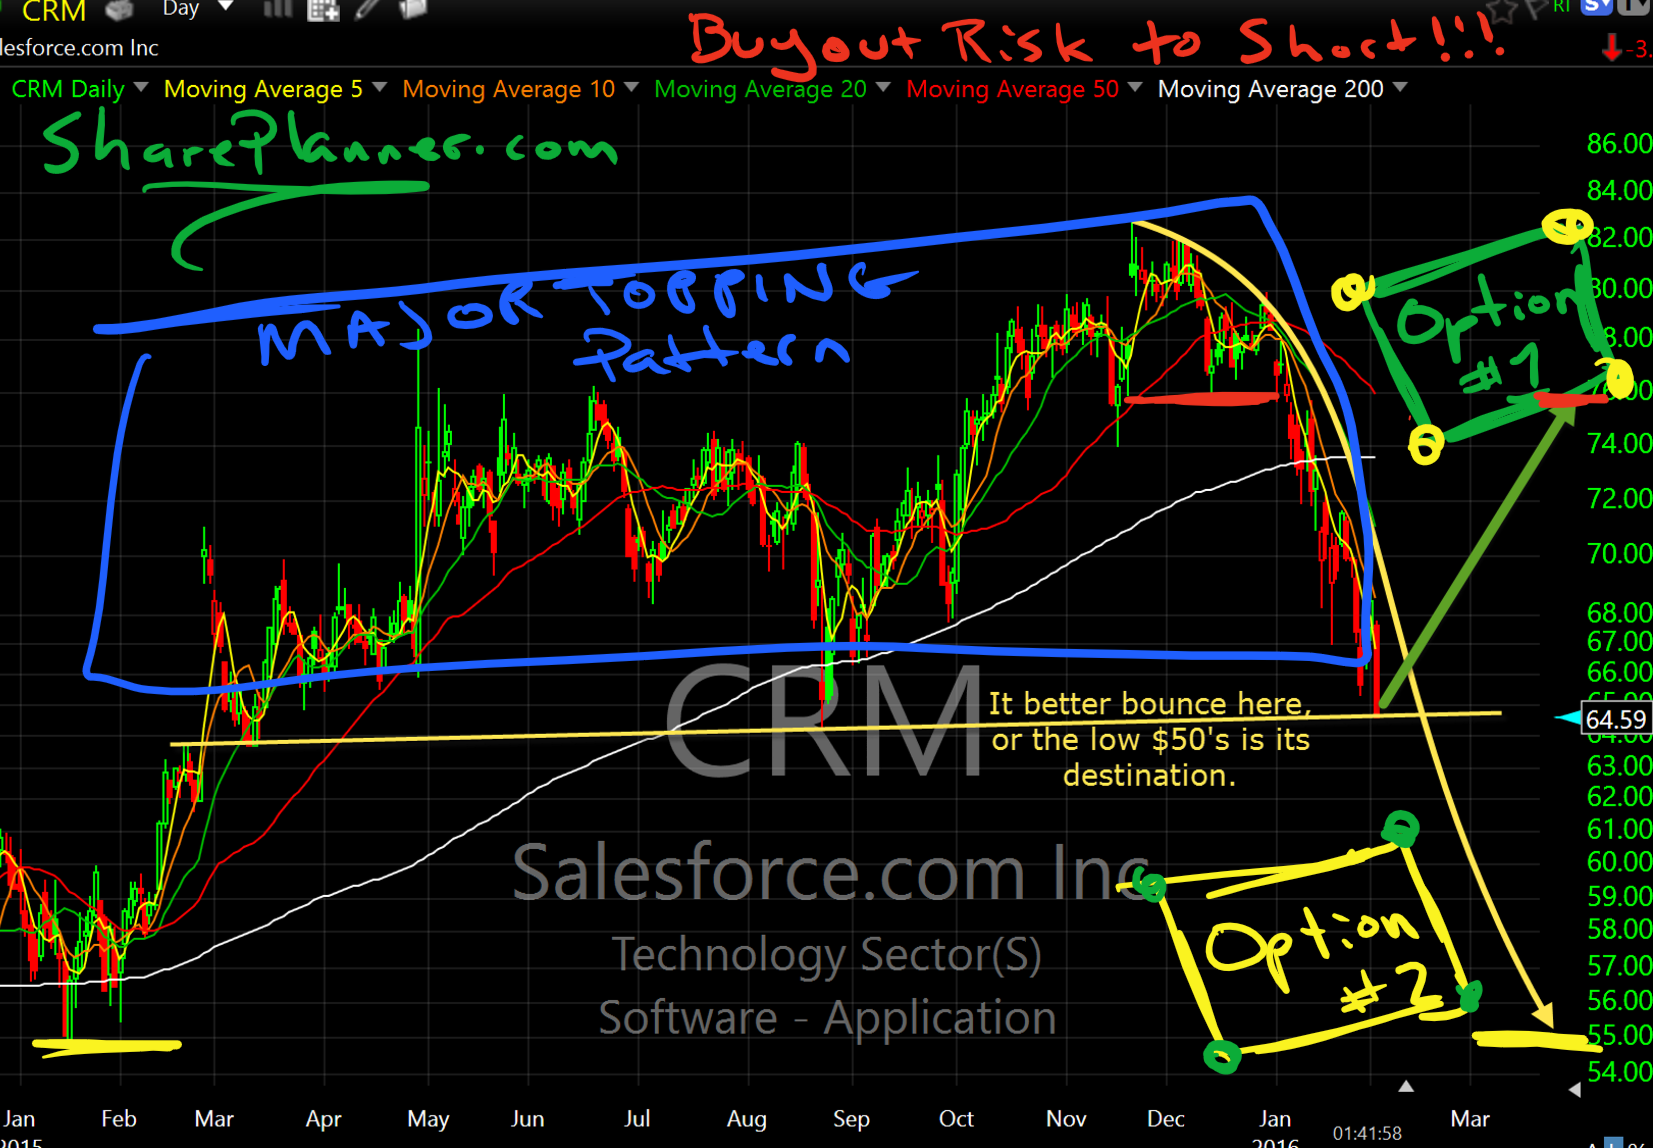
Here’s my take on SalesForce (CRM). Personally there is not way you are going to get me to short this. The stock is constantly the subject of buyout rumors and is not worth it not matter how bearish the chart is. But that doesn’t preclude me from doing a post on this dismal looking chart

Facebook (FB) has had quite the day! Currently up almost 17%, the stock continues to make a push towards new all-time highs, and there is a strong chance that by the end of the day it will have achieved that. The frustrations for traders who put a premium on managing risk is that

This weekly chart shows you all you need to know about what Apple (AAPL) must do going forward. Break below this month’s lows, and it could see that move that takes us well into the $80’s. You also have a massive head and shoulders pattern on the weekly chart that has formed over the
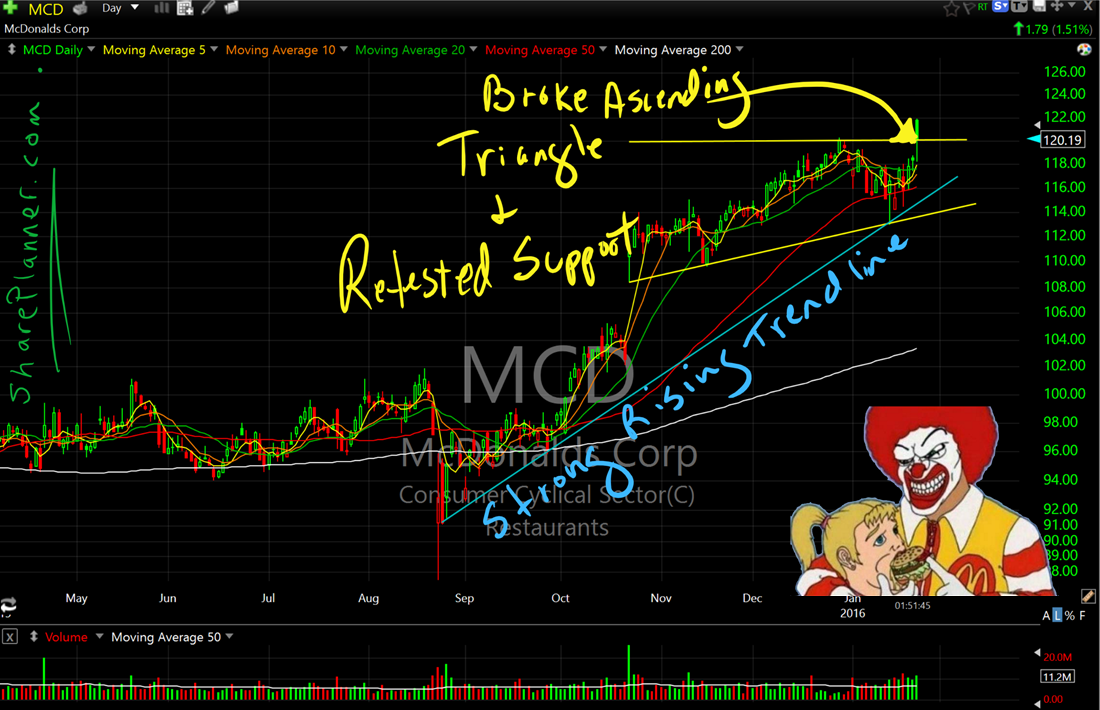
Earnings were good today for America’s most hated fast food chain, McDonalds (MCD). Personally, I think Burger King and Taco Bell are a hundred times worse and causes an automatic gag reaction just driving by one of them. Nonetheless, MCD seems to found a gem in 24 hour breakfast menus across the country. Personally,
The kind of trading week you saw last week is pretty much as wild as it gets in the stock market. Sell-offs that take you to the brink of a market crash followed by a market rally that gives you the impression that, at the very least, a market bottom could be in place. The

The current price action today is being somewhat hampered by the price action on the 30 minute chart. You have the prices falling some off of the highs of the day, though oil still remains up a whooping 4.6% on the day. On the 30 minute chart you’ll see that price action has run hard

I’m in a situation that five hours ago, didn’t seem like a strong possibility and that is being 100% cash. The futures were looking great, and even 30 minutes into the trading session, the selling really hadn’t picked up that much steam, but as we continue to see, the market cannot hold on to its
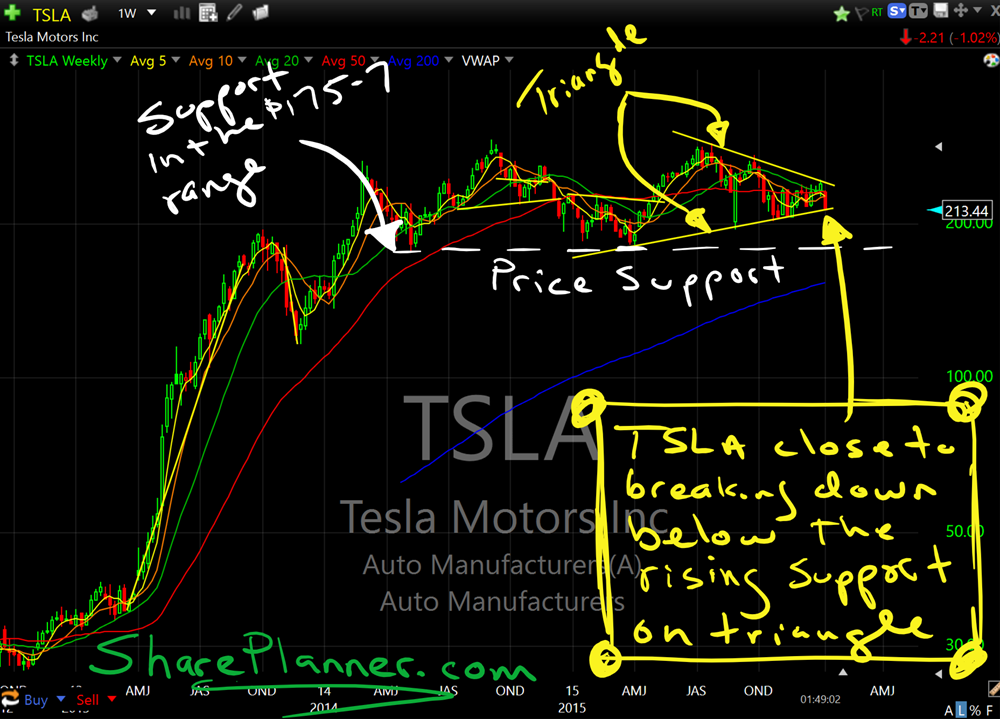
One reader asked me to give a looksie to the Tesla (TSLA) chart to see what I could find and whether there is an edge there to trade. Finding that edge was difficult at first as TSLA’s stock price is all over the place on the daily. But when I zoomed out some and

VIX is continuing to trade in an ever-so-slightly narrowing triangle-like pattern. While we are having violent trading sessions that sees the VIX pop in excess of 10% on a regular basis, the band on the daily chart in which it is trading in continues to get smaller. That doesn’t mean that we’ll see less

2015 was gone at the strike of midnight and with its farewell comes 2016. For almost every trader out there, that is great news. It is the hope of all traders that the potential for profitability in 2016 is much more attainable. In this past year stocks were down, bonds were down, commodities crashed, hedge

spc@shareplanner.com
(904) 800-8420
© Copyright 2025 | SharePlanner Inc. All Rights Reserved.
Disclaimer: The information provided on this website is for educational and informational purposes only. Ryan Mallory and/or SharePlanner are not licensed financial advisors, brokers, or tax professionals. The content on this site should not be considered as financial, investment, tax, or legal advice.
All information and opinions expressed herein are based on sources believed to be accurate and reliable. However, we make no representation or warranty as to their accuracy, completeness, or reliability. Any action you take upon the information on this website is strictly at your own risk.
Past performance is not indicative of future results. Investing involves risk, including the possible loss of principal. All investors should make their own decisions based on their specific investment objectives and financial circumstances.
This site may contain links to external websites that are not provided or maintained by or in any way affiliated with Ryan Mallory and/or SharePlanner. Please note that Ryan Mallory and/or SharePlanner do not guarantee the accuracy, relevance, timeliness, or completeness of any information on these external websites.
By using this website, you agree that Ryan Mallory and/or SharePlanner and any affiliated parties are not responsible for any losses or damages resulting from your use of or reliance on the information provided.
It is strongly recommended that you consult with a qualified professional before making any financial decisions.