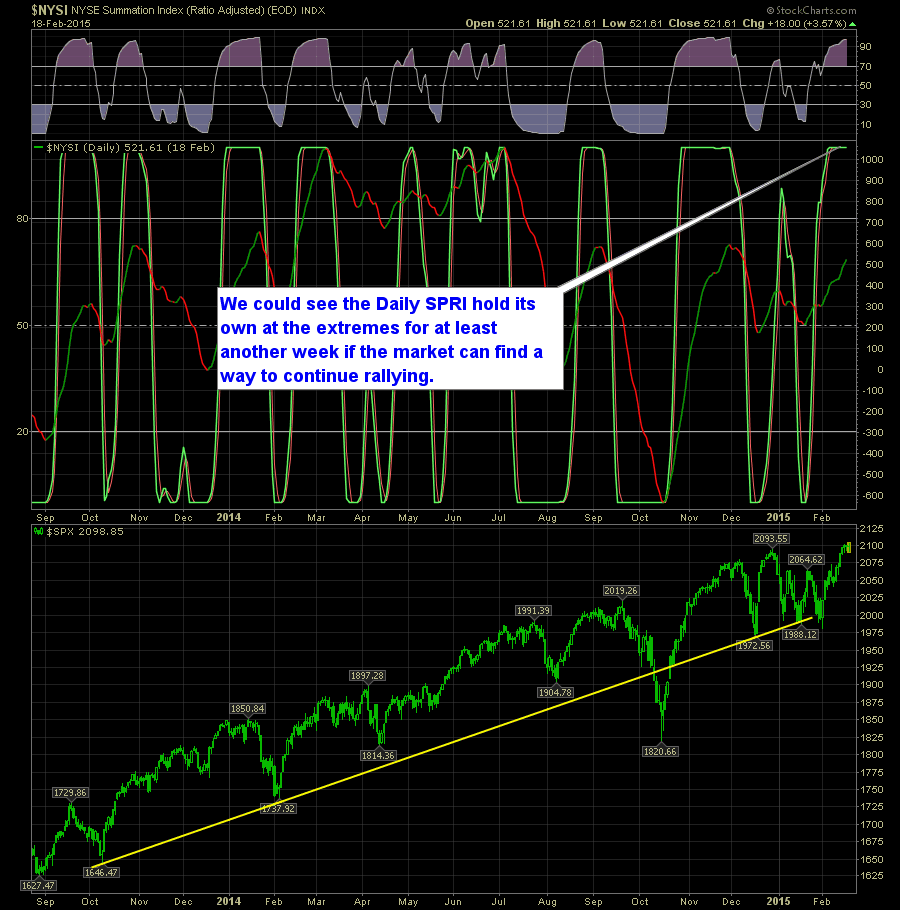
SharePlanner Reversal Indicator is at the extremes on both times frames. On the Daily SPRI you have price now for a second consecutive week sitting at the bullish extremes and that shouldn’t be all that surprising considering the fact that SPX has rallied over 100 points so far this month. I expect that the
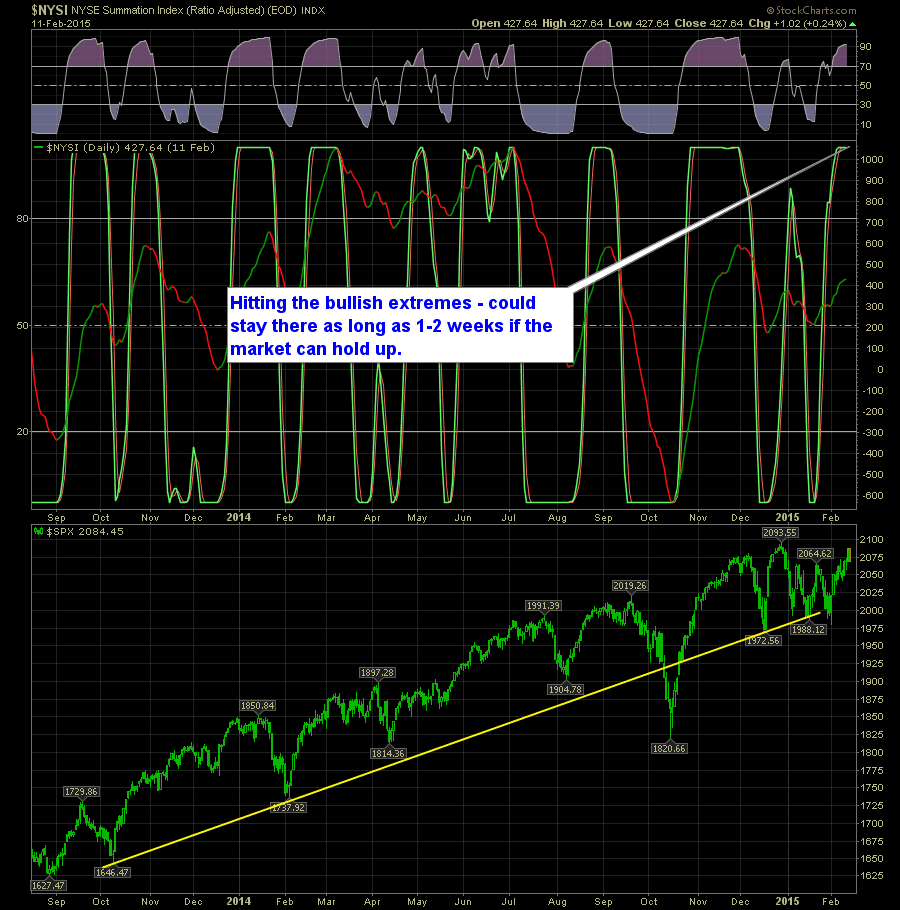
Earlier today in the SharePlanner Splash Zone, I mentioned that that the daily chart of SPX was probably the healthiest I’ve seen it at any point this year. And the same can easily be said about the SharePlanner Reversal Indicator on both time frames. On the daily, you have the SPRI hitting extremes, but

SharePlanner Reversal Indicator showing uniform bullishness The daily SPRI is showing an extreme reading, but just because there is an extreme reading doesn’t necessarily mean that a top is in the market, as it often will spend 1-2 weeks in that area. Here’s the Daily SPRI:

The SharePlanner Reversal Indicator charts are both pointing up but are both on shaky ground. The Daily SPRI is in the latter parts of its move, and nearing what could be some resistance before reaching the extremes. Here’s the Daily SPRI:
For immediate release Information received since the Federal Open Market Committee met in December suggests that economic activity has been expanding at a solid pace. Labor market conditions have improved further, with strong job gains and a lower unemployment rate. On balance, a range of labor market indicators suggests that underutilization of labor resources

Another week of mixed signals on the SharePlanner Reversal Indicator. Sometimes these things take time to shake themselves loose. Right now on the Daily SPRI you have an imminent bullish signal that could occur any day now. Here’s the Daily SPRI:
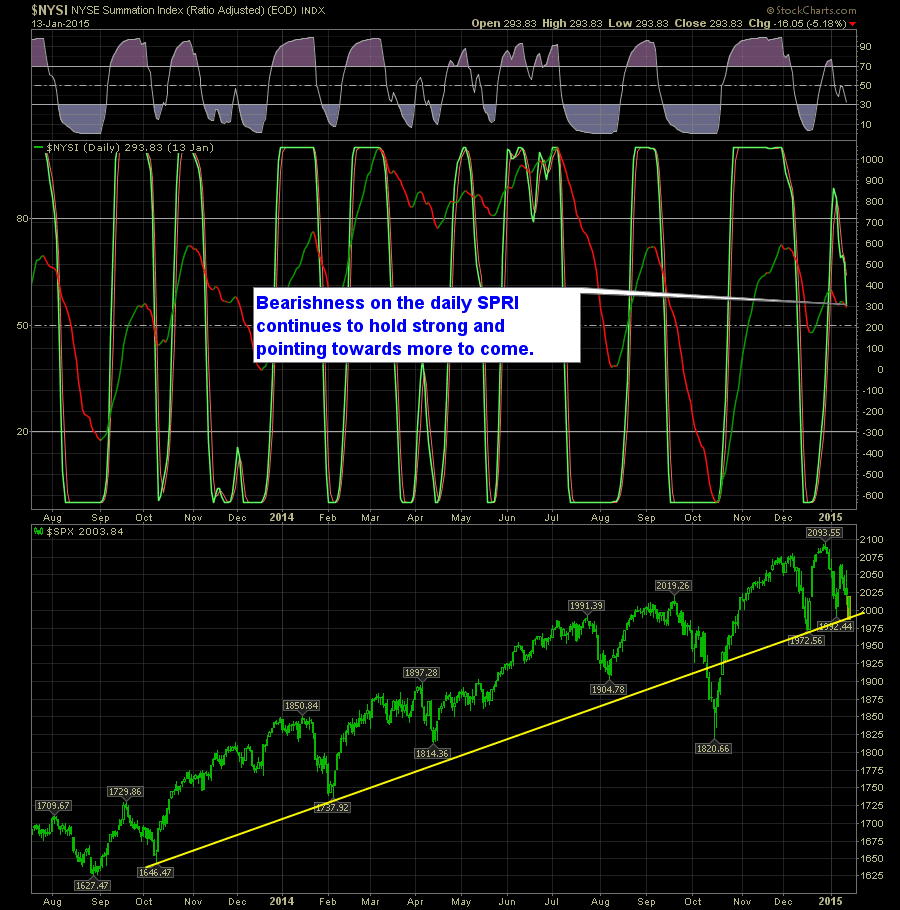
The SharePlanner Reversal Indicator continues to show us mixed signals here on the two different time frames. On the Daily SPRI, you have a strong downward move that is currently taking place and in line with the broader market. Here’s the Daily SPRI:

On the daily chart of the SharePlanner Reversal Indicator, you have what I consider to be an early reversal to the downside. This is being heavily impacted by the recent 5-day sell-off. However, what it hasn’t taken into consideration is today’s monster ramp up which will likely hamper the bearish enthusiasm of the Daily SPRI, if not
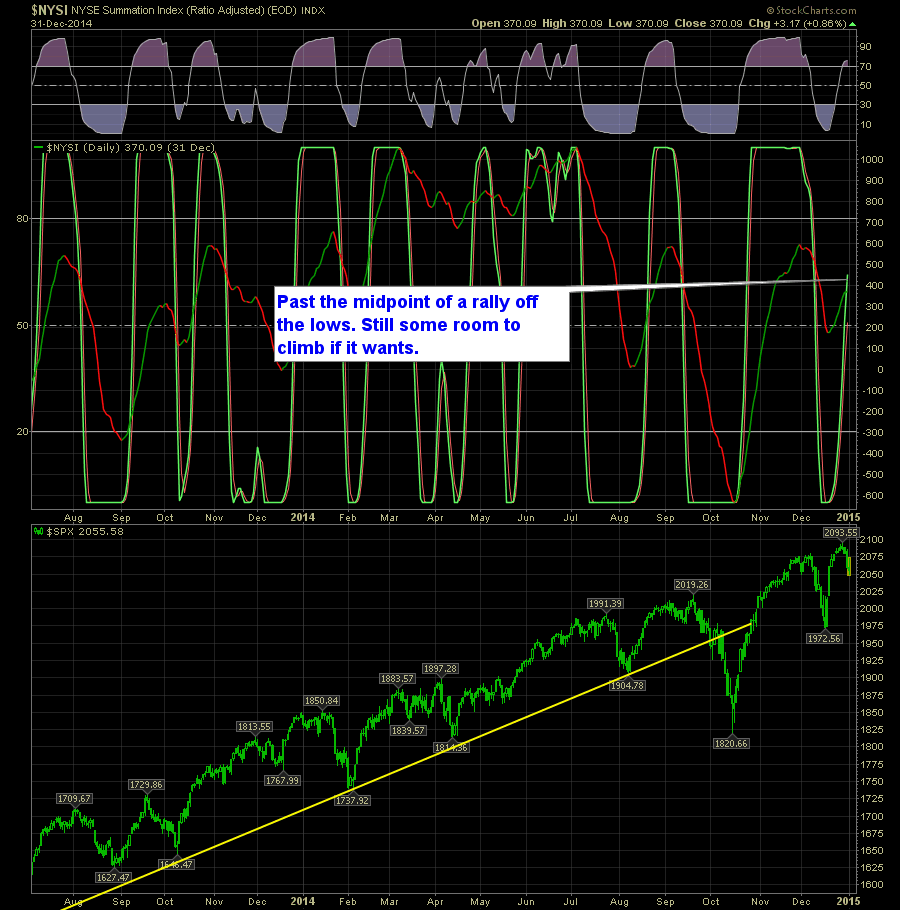
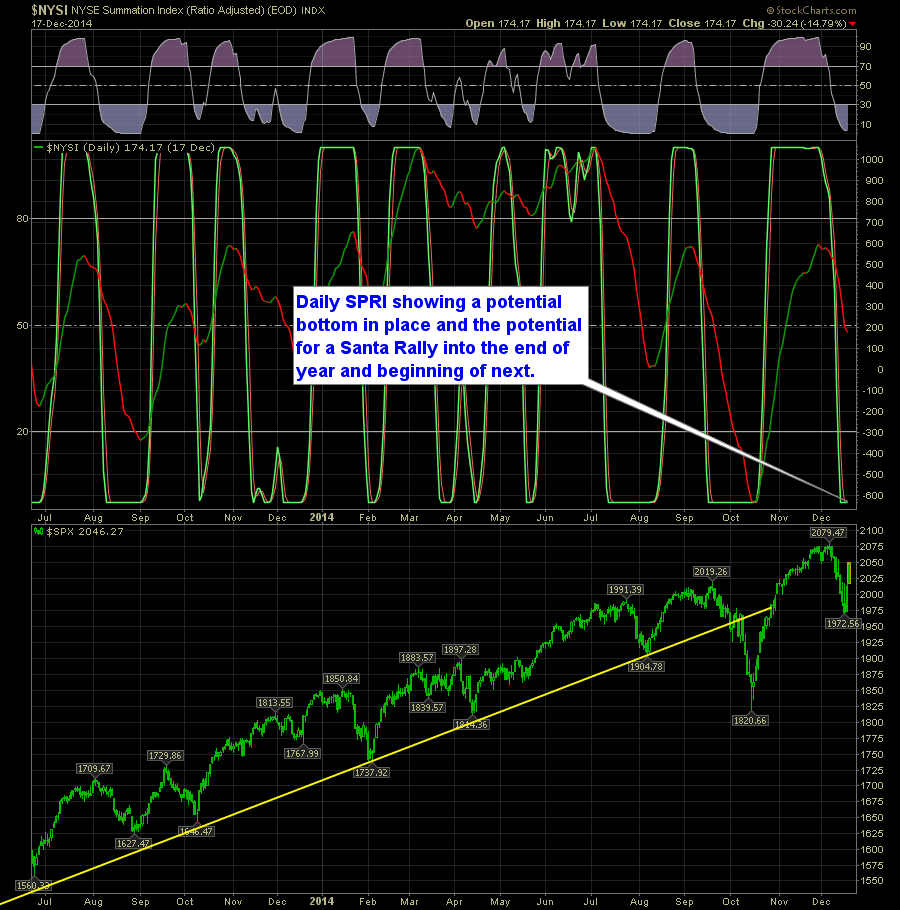
SharePlanner Reversal Indicator hasn’t given way to the recent selling over the past three days. In fact it continues to flash some impressive bullishness. Just below you can see where the Daily SPRI nailed the bottom back on 12/17 and still has some room to run overhead before getting overextended. Here’s the Daily SPRI:
The last two days have no doubt been huge, and it is aligning nearly perfectly with the Daily chart for the SharePlanner Reversal Indicator. Here is the Daily SPRI:

spc@shareplanner.com
(904) 800-8420
© Copyright 2025 | SharePlanner Inc. All Rights Reserved.
Disclaimer: The information provided on this website is for educational and informational purposes only. Ryan Mallory and/or SharePlanner are not licensed financial advisors, brokers, or tax professionals. The content on this site should not be considered as financial, investment, tax, or legal advice.
All information and opinions expressed herein are based on sources believed to be accurate and reliable. However, we make no representation or warranty as to their accuracy, completeness, or reliability. Any action you take upon the information on this website is strictly at your own risk.
Past performance is not indicative of future results. Investing involves risk, including the possible loss of principal. All investors should make their own decisions based on their specific investment objectives and financial circumstances.
This site may contain links to external websites that are not provided or maintained by or in any way affiliated with Ryan Mallory and/or SharePlanner. Please note that Ryan Mallory and/or SharePlanner do not guarantee the accuracy, relevance, timeliness, or completeness of any information on these external websites.
By using this website, you agree that Ryan Mallory and/or SharePlanner and any affiliated parties are not responsible for any losses or damages resulting from your use of or reliance on the information provided.
It is strongly recommended that you consult with a qualified professional before making any financial decisions.