Getting some selling action out of the market today, which even in the strongest of uptrends, is totally necessary. One thing I am noticing so far in the day is that the rising 5-day moving average has been tested perfectly and has held perfectly. So the bulls have that going in their favor right now.
For immediate release Information received since the Federal Open Market Committee met in September suggests that economic activity has been expanding at a moderate pace. Household spending and business fixed investment have been increasing at solid rates in recent months, and the housing sector has improved further; however, net exports have been soft. The pace

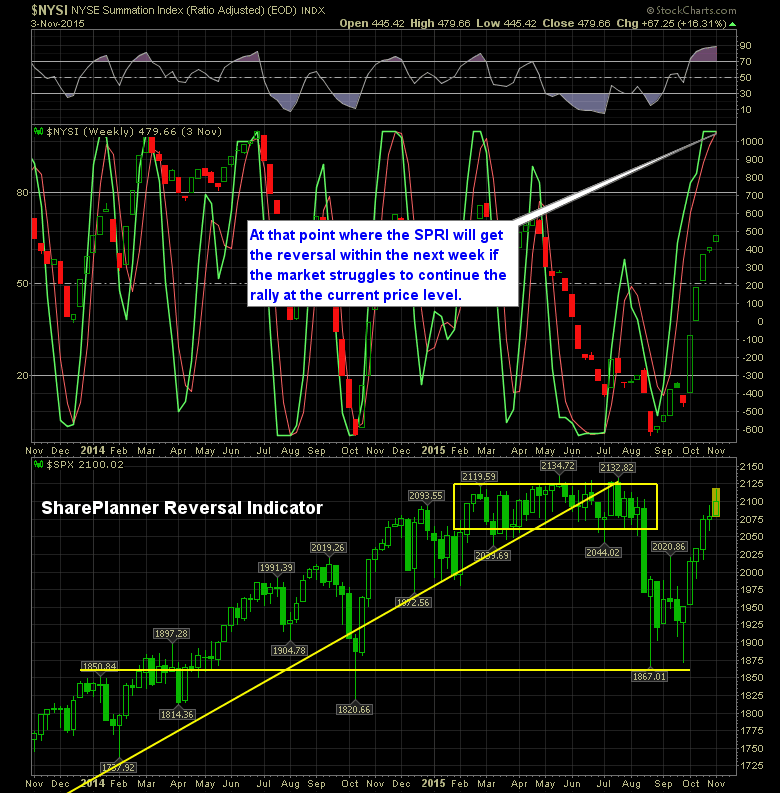
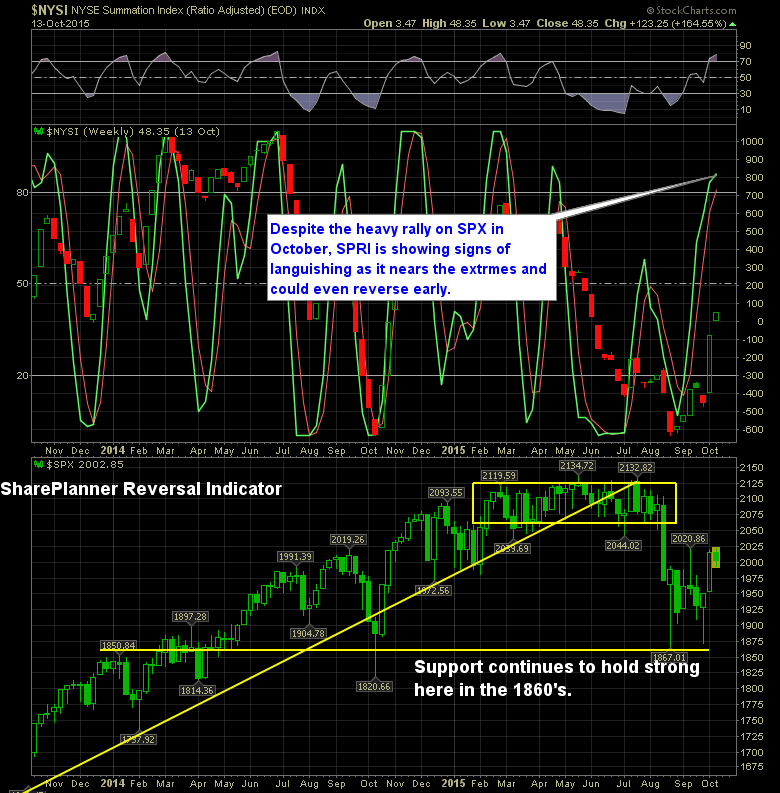
I was surprised to see the SharePlanner Reversal Indicator starting to show signs of possible bearishness. As you can see from the chart below, there is some hints of a possible reversal in the making. So much so, that I would guess that if we don’t see a strong rally by the end of the
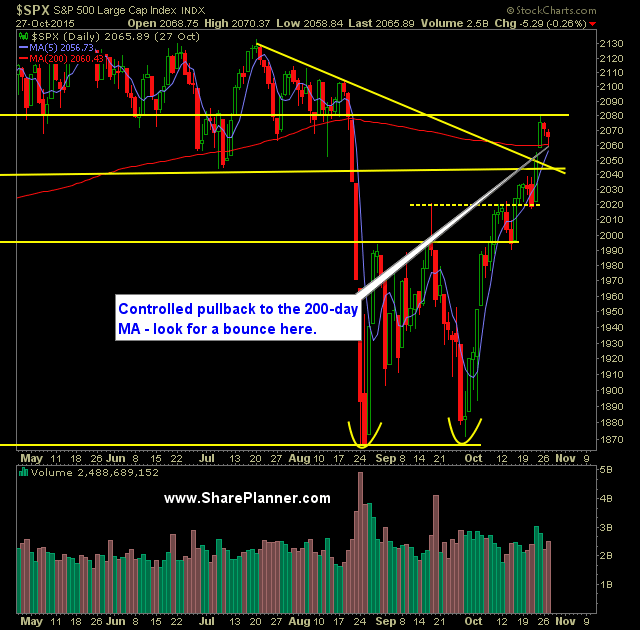
Technical Outlook: SPX pulled back perfectly to the 200-day moving average yesterday and formed a nice hammer candle right off of it. The selling of the past two days has been methodical and orderly – no panic whatsoever. Volume on SPY has been non-existent the last two days and less than half of what
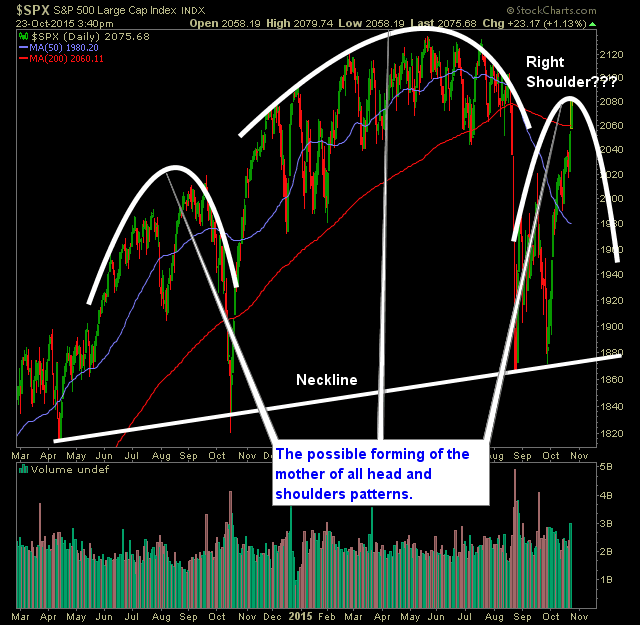
This is still a working pattern and by no means is there any guarantees behind it. But I spend a lot of time every day going through probably a thousand charts or so, and I spend a lot of time staring at the charts of the major indices. Well, today, this pattern leaped out at
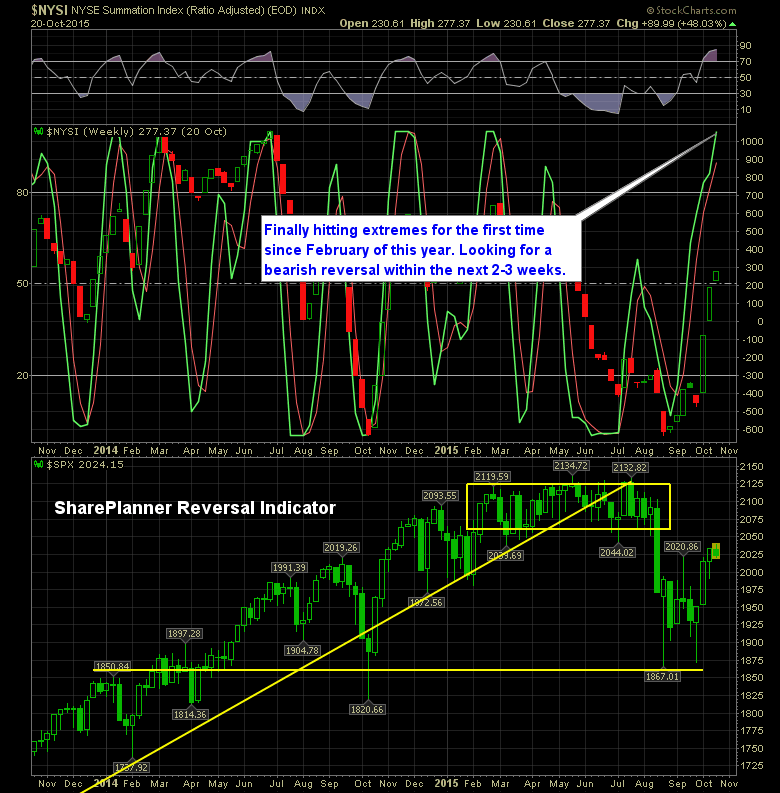
SharePlanner Reversal Indicator finally hitting bullish extremes. That doesn’t mean sell all your stocks and get short. Far from it. For now it simply means that the bulls are starting to hit some major extremes in the current rally – extremes that haven’t been seen since the only other legitimate market rally of the year
The SharePlanner Reversal Indicator is still pointing to the upside. Should the selling persist in the coming days in the market you may be able to get an early reversal out of SPX. Otherwise, the SPRI is still pointing towards more upside for this market. Once it hits those extremes (and it is close to doing
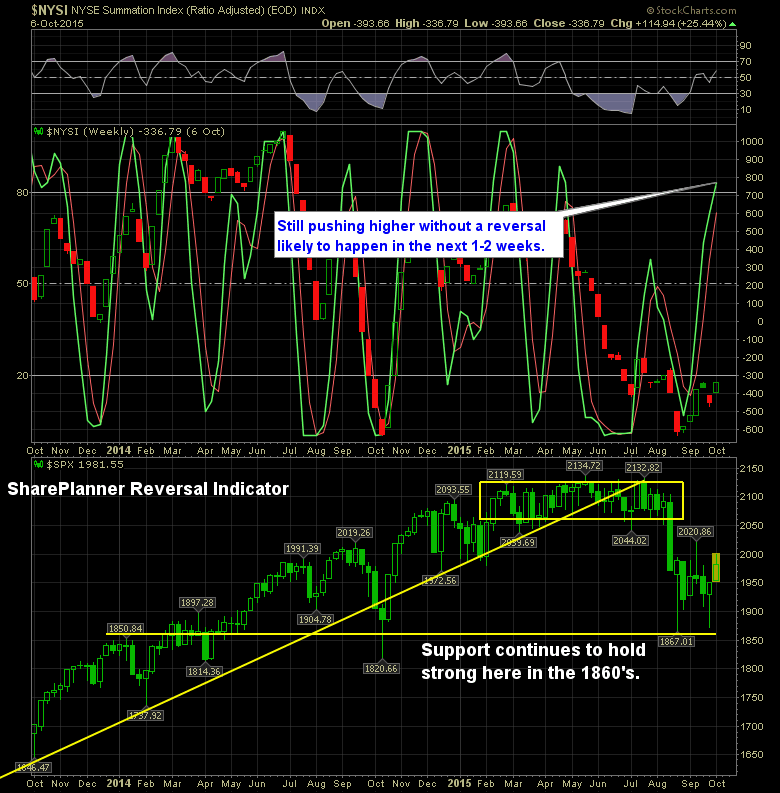
The selling in the last two days has felt a whole lot worse for the market than the indices would suggest. Your market leaders, in general, are taking a thrashing, while oil and commodities continue to rally. On the SharePlanner Reversal Indicator, it still suggests that this market has more upside left to it. After
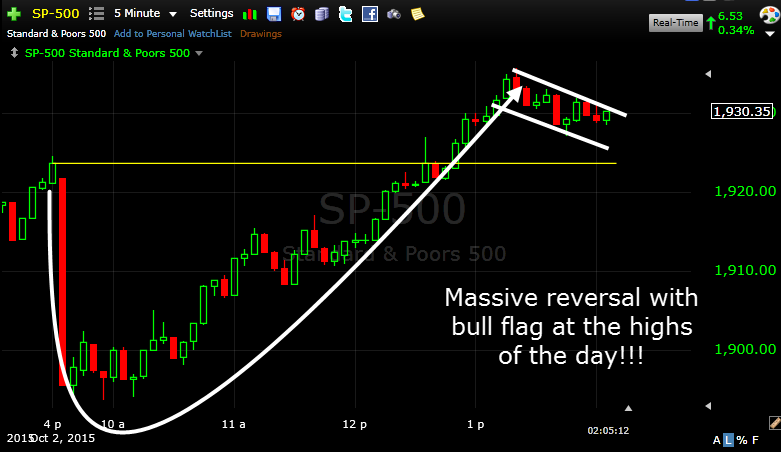
I came into the day 20% long and now I am currently 40% long. If you told me this morning I’d be doubling my long exposure, I might have thought it would be unlikely, but when you get one of the biggest reversals of the year to erase a 30 point loss, and actually push

spc@shareplanner.com
(904) 800-8420
© Copyright 2025 | SharePlanner Inc. All Rights Reserved.
Disclaimer: The information provided on this website is for educational and informational purposes only. Ryan Mallory and/or SharePlanner are not licensed financial advisors, brokers, or tax professionals. The content on this site should not be considered as financial, investment, tax, or legal advice.
All information and opinions expressed herein are based on sources believed to be accurate and reliable. However, we make no representation or warranty as to their accuracy, completeness, or reliability. Any action you take upon the information on this website is strictly at your own risk.
Past performance is not indicative of future results. Investing involves risk, including the possible loss of principal. All investors should make their own decisions based on their specific investment objectives and financial circumstances.
This site may contain links to external websites that are not provided or maintained by or in any way affiliated with Ryan Mallory and/or SharePlanner. Please note that Ryan Mallory and/or SharePlanner do not guarantee the accuracy, relevance, timeliness, or completeness of any information on these external websites.
By using this website, you agree that Ryan Mallory and/or SharePlanner and any affiliated parties are not responsible for any losses or damages resulting from your use of or reliance on the information provided.
It is strongly recommended that you consult with a qualified professional before making any financial decisions.