
Last week I said to be cautious in reacting to the bearish signals the daily and weekly SharePlanner Reversal Indicator was providing. My reasoning mainly had to do with the weekly reversal signal that was not quite at extremes and it made sense that there would probably be another one last push on the weekly

Here is this week’s SharePlanner Reversal Indicator Update. On the daily chart, you can see how prior to last week it had finally reversed but got no where with the 6-day rally that we had up until yesterday. As a result the daily SPRI has gone right back to the top but yet to confirm
Information received since the Federal Open Market Committee met in April indicates that growth in economic activity has rebounded in recent months. Labor market indicators generally showed further improvement. The unemployment rate, though lower, remains elevated. Household spending appears to be rising moderately and business fixed investment resumed its advance, while the recovery in the

On the SharePlanner Reversal Indicator using the daily chart, you can see we received a bearish reversal signal: Here’s the Daily SPRI:

SharePlanner Reversal Indicator at bullish extremes On the daily, for the second consecutive week it is at upper extremes which tends to indicate a bearish reversal could happen shortly. Here’s the Daily SPRI:
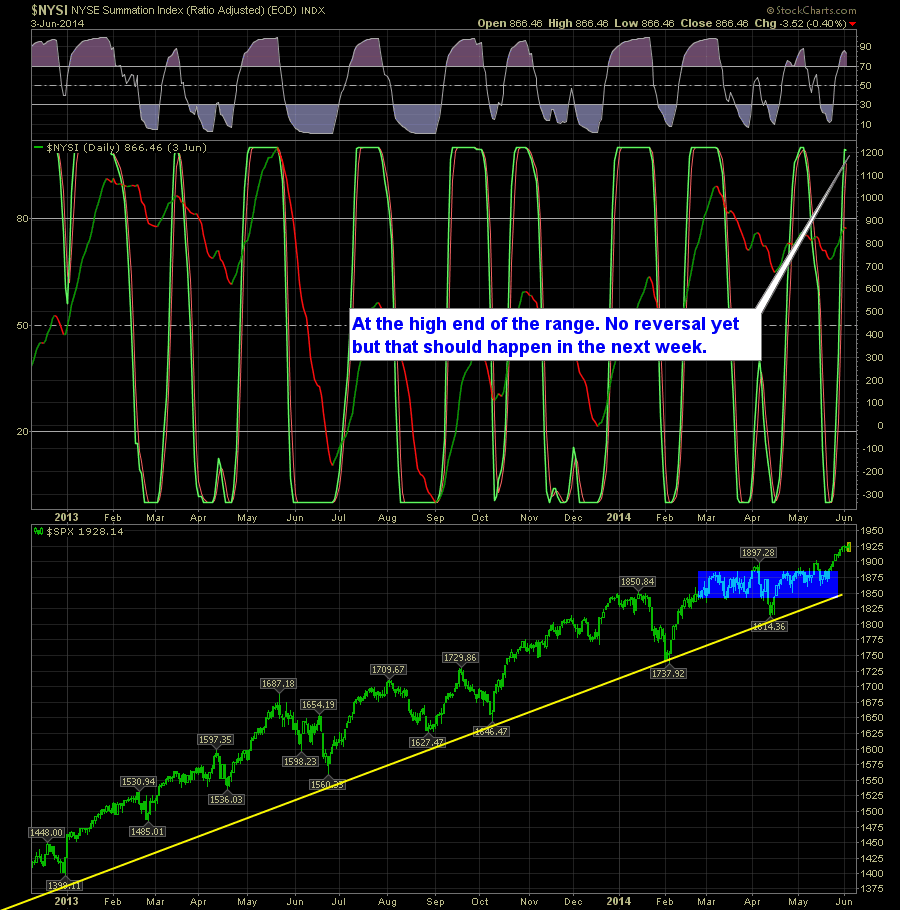
I’m starting to finally see some cohesiveness on the SharePlanner Reversal Indicator The past few weeks there was a discrepancy between the daily and weekly time frames. Now that seems to be gone. The Daily SPRI is still pushing higher and into the extremes of the range. Here’s the Daily SPRI:
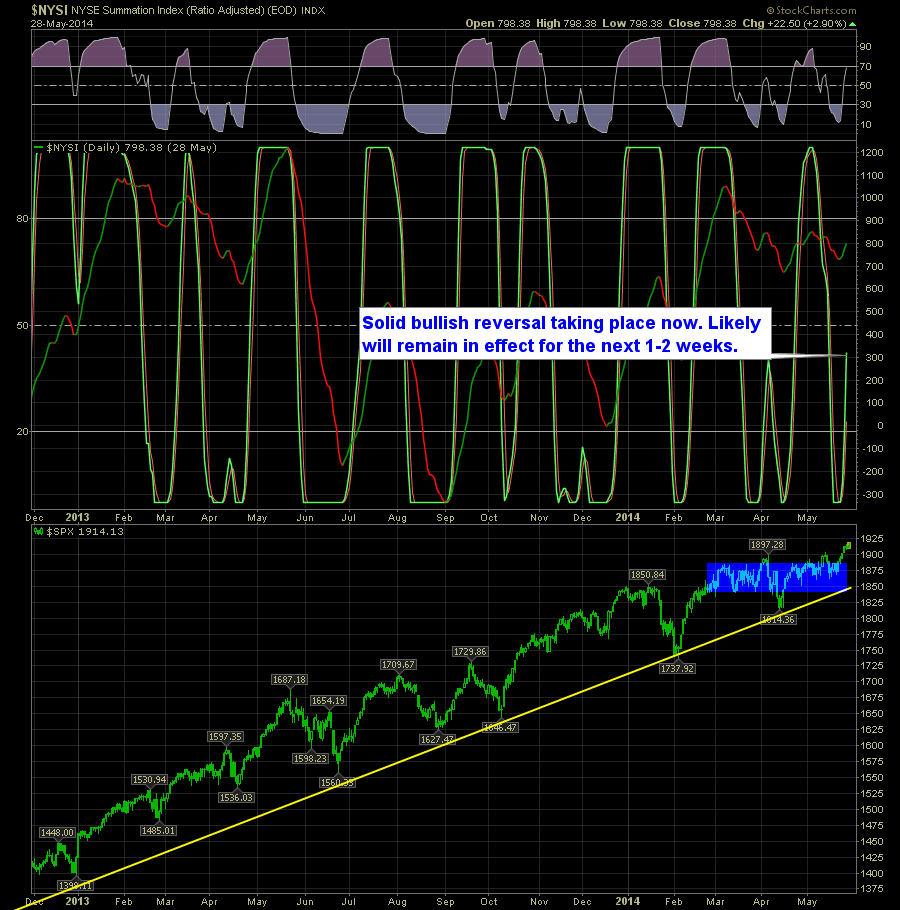
The SharePlanner Reversal Indicator still remains a difficult read. Here you have the Daily SPRI where it is in a full fledge uptrend that should last at least 1-2 weeks. Here’s the Daily SPRI:
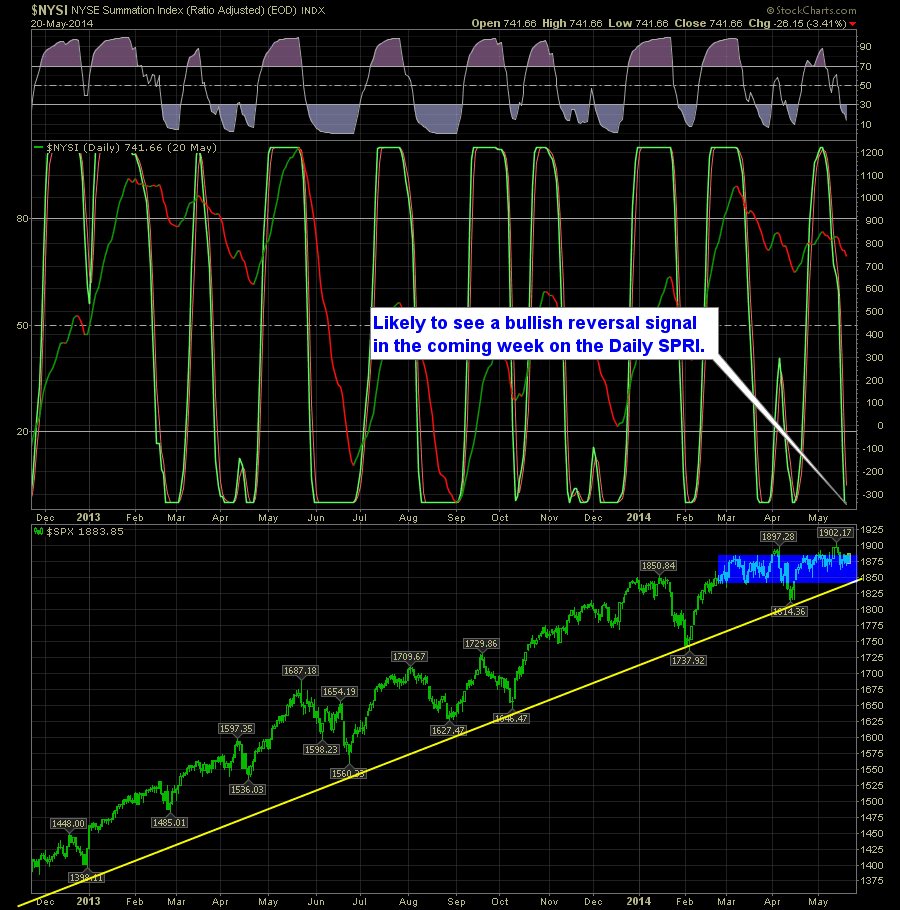
Another week of differences between the Daily and Weekly SharePlanner Reversal Indicator. The daily is showing itself to be on the verge of a full-on bullish reversal, which will look great with the current price action, if SPX can push back above 1890, preferably 1900 on the S&P 500. Here’s the Daily SPRI:

Pre-market update: Asian markets traded 0.5% higher. European markets are trading 0.3% lower. US futures are trading 0.1% lower ahead of the market open. Economic reports due out (all times are eastern): ICSC-Goldman Store Sales (7:45), Redbook (8:55) Technical Outlook (SPX): Excellent follow through on Friday’s bounce. Challenged, broke and closed above the pivotal 1883 price

The SharePlanner Reversal Indicator (SPRI) is comprised of two separate view points: a daily and a weekly. Typically the Weekly is a much stronger measurement of market direction going forward. The daily can be a bit more fickly as it reacts more to the day-to-day machinations of the stock market. As a result, when there

spc@shareplanner.com
(904) 800-8420
© Copyright 2025 | SharePlanner Inc. All Rights Reserved.
Disclaimer: The information provided on this website is for educational and informational purposes only. Ryan Mallory and/or SharePlanner are not licensed financial advisors, brokers, or tax professionals. The content on this site should not be considered as financial, investment, tax, or legal advice.
All information and opinions expressed herein are based on sources believed to be accurate and reliable. However, we make no representation or warranty as to their accuracy, completeness, or reliability. Any action you take upon the information on this website is strictly at your own risk.
Past performance is not indicative of future results. Investing involves risk, including the possible loss of principal. All investors should make their own decisions based on their specific investment objectives and financial circumstances.
This site may contain links to external websites that are not provided or maintained by or in any way affiliated with Ryan Mallory and/or SharePlanner. Please note that Ryan Mallory and/or SharePlanner do not guarantee the accuracy, relevance, timeliness, or completeness of any information on these external websites.
By using this website, you agree that Ryan Mallory and/or SharePlanner and any affiliated parties are not responsible for any losses or damages resulting from your use of or reliance on the information provided.
It is strongly recommended that you consult with a qualified professional before making any financial decisions.