
Going back the past three months the area surrounding 16.40 has no doubt offered a great deal of support/resistance. Now again, just a little over two days since the VIX was over 26, it is now testing that 16.40 area again. Granted it is trading below the support level now, but I think of

Just for a minute and take a look at the chart of the Nasdaq for the past two years. It has to be the worst time period ever for the chart. There is no direction, no conviction and more importantly, no sustainability in either direction. Every dip is met with insatiable buying and every

The SharePlanner Reversal indicator suggests the bulls might not be out of the woods just yet. This week it is flashing an early reversal which really comes as no surprise following the massive sell-off on Friday and then again on Monday after the Brexit vote. Now the market is on an impressive two day rally

I love the T2108 in markets like this. When volatility is at extremes, there is no better indicator out there for gauging market direction and how close we might be to a bottom. The bad news, is that a bottom might not be achievable just yet. Of course that doesn’t mean bounces can’t occur, but
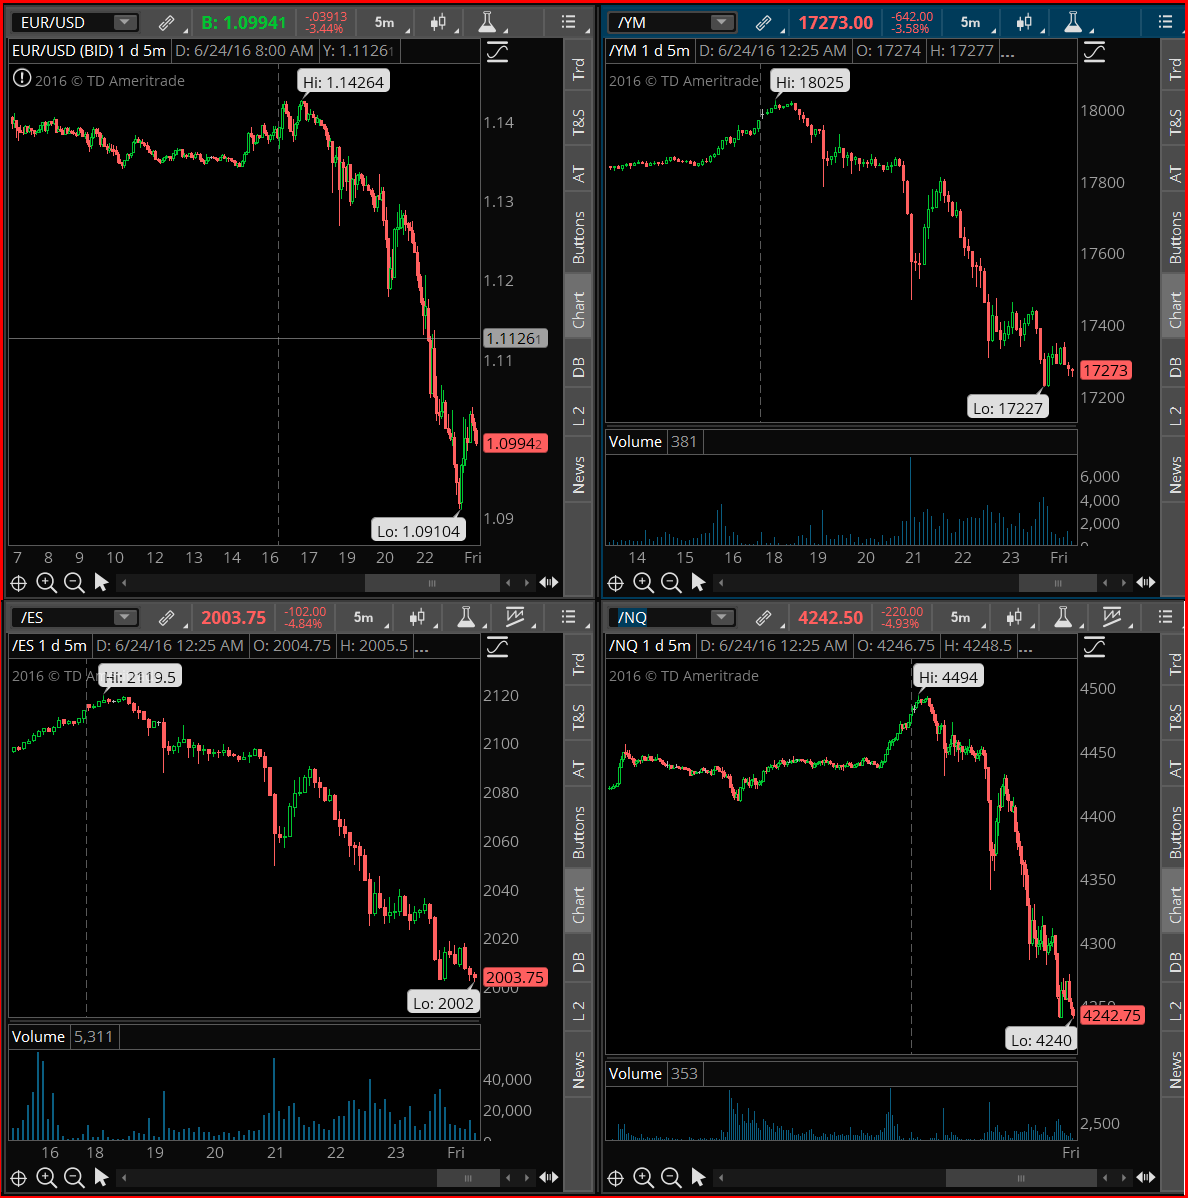
I can’t go to sleep – I just can’t. I mean c’mon, how often do you get to see SPX futures down 100 points, circuit breakers triggering, Dow futures down over 600 points, among other things. I don’t have any positions going into tomorrow. I sold my one long position and covered my
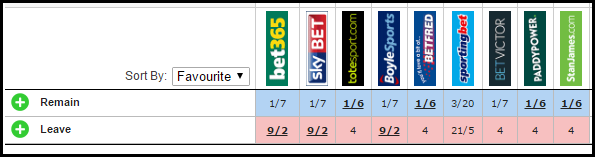
Here is an update on the latest on the Brexit and what the odds makers are expecting. Not much of a change from this morning as you can see. Overall there is about a 4:1 chance of a Brexit/Leave. As for tonight's schedule - I found this tweet here - highly informational from @verniman Essentially
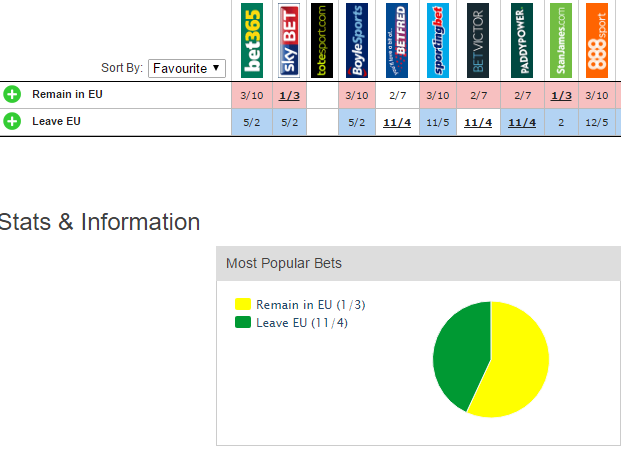
I thought I’d throw this out there for you all to consider. This is what the odds makers are showing on the possibility of a brexit. Currently about 43% of the bets are on a vote to “Leave” the European Union or commonly referred to as a “Brexit”. The “Remain” camp is seeing about 57%

It has been a while since I posted about the 30 minute chart on the S&P 500 – but here I go. The upward trend-line has been broken, off of the June 16th lows. However, you have this stubborn support/resistance level at 2085 depending on which side of price SPX happens to be on.

So far the month of June has been extremely tricky for traders. Overall it is down and in 13 trading sessions, 7 of them are negative. But at the same time, this market marched right up to within 1% of new all-time highs just a week ago. But as we have seen plenty of times

There is a very nice retest taking place on USO and its rising trend-line off of the February lows. We’ve seen oil in the past, crush through many technical barriers to the downside, and I’m not even sure I want to play this bounce at this moment, but the temptation is definitely there.

spc@shareplanner.com
(904) 800-8420
© Copyright 2025 | SharePlanner Inc. All Rights Reserved.
Disclaimer: The information provided on this website is for educational and informational purposes only. Ryan Mallory and/or SharePlanner are not licensed financial advisors, brokers, or tax professionals. The content on this site should not be considered as financial, investment, tax, or legal advice.
All information and opinions expressed herein are based on sources believed to be accurate and reliable. However, we make no representation or warranty as to their accuracy, completeness, or reliability. Any action you take upon the information on this website is strictly at your own risk.
Past performance is not indicative of future results. Investing involves risk, including the possible loss of principal. All investors should make their own decisions based on their specific investment objectives and financial circumstances.
This site may contain links to external websites that are not provided or maintained by or in any way affiliated with Ryan Mallory and/or SharePlanner. Please note that Ryan Mallory and/or SharePlanner do not guarantee the accuracy, relevance, timeliness, or completeness of any information on these external websites.
By using this website, you agree that Ryan Mallory and/or SharePlanner and any affiliated parties are not responsible for any losses or damages resulting from your use of or reliance on the information provided.
It is strongly recommended that you consult with a qualified professional before making any financial decisions.