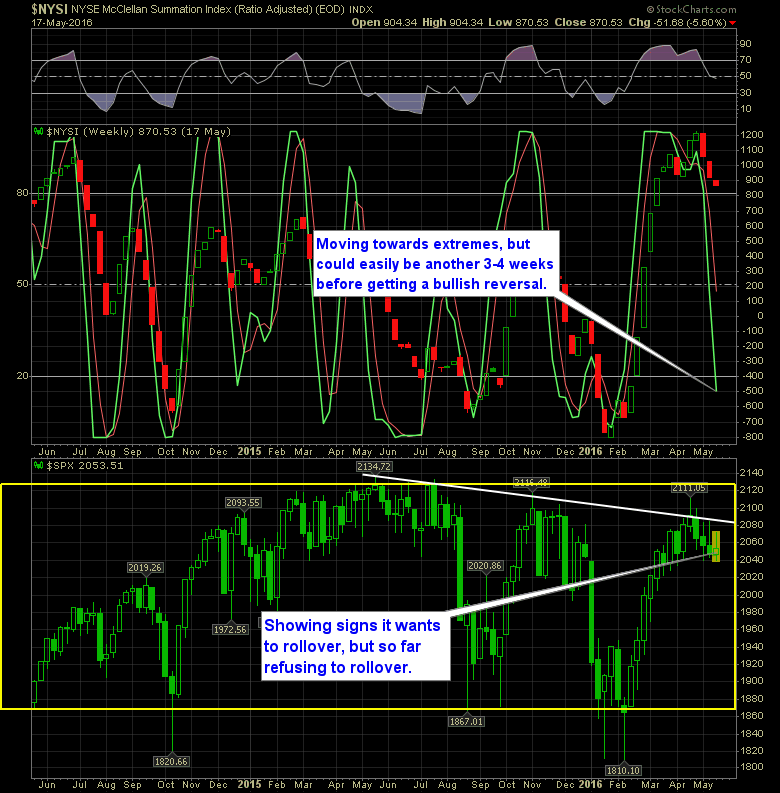
The weekly read of the SharePlanner Reversal Indicator is still pointing lower. Though we are starting to enter the more “mature”phase of the indicator. Sometimes this is where if there has been some heavy selling already, it can start to show signs of slowing down. Problem with this market, is that despite being lower for

There is very little about this market that is easy. In fact this head and shoulders chart pattern is so magnificent that I’m almost skeptical of it ever actually playing out anywhere near its full potential. Nonetheless it is a massive topping pattern and a darn near perfect one at that.
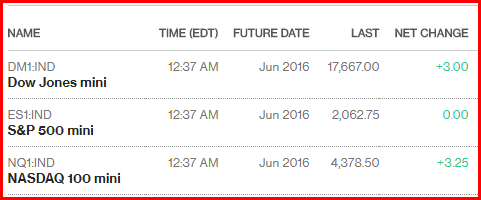
Quick glimpse at how the market is playing right now following the hard rally earlier today. All is quiet, nothing is really moving. Europe opens up in a bit and that may breath some life into this market for better or worse. Here’s the futures:

Volatility started off strong this morning, but throughout the morning, it has been crushed falling from a high of 15.86 to as low as 14.69. All of this says is interesting for fodder, but what is more important is where it leaves us and that is in a tight range on VIX with a

For those wondering when they should be taking profits on their oil trades, never fear, Dennis Gartman just went bullish on crude. For those who are not aware, this is the individual who has a track record of being the most perfect contrarian indicator that our generation has ever seen. Yes, Jim Cramer was

The bears really have to pay close attention to the 50-day moving average. Until last Friday this MA had been irrelevant to the market, paying little to no attention to it. But last Friday it bounced hard after dipping below it intraday, and then went on to rally three straight days. Today, the bulls gave

Yup – you got it – a head and shoulders pattern on the daily chart. Folks – we have head and shoulders inside of head in shoulders that are inside of head and shoulders. Quite Frankly I’m afraid that if one H&S pattern sees another H&S pattern that it could create an alternate reality that

It shouldn’t be a surprise to anyone that the market is trying to sell-off today following yesterday’s beautiful rally. We are in that area of the charts where every rally over the last two-plus years has stalled out at. So yes, expect rallies in the 2040 to 2138 range to continue stalling out until it

It was a very uneventful 6.5 hours today – time that you can never get back. The futures are about 8 points off of its trading lows this evening and try to perk up for a run tomorrow. After watching today’s action, and the action from last week, neither side seems to be that interested
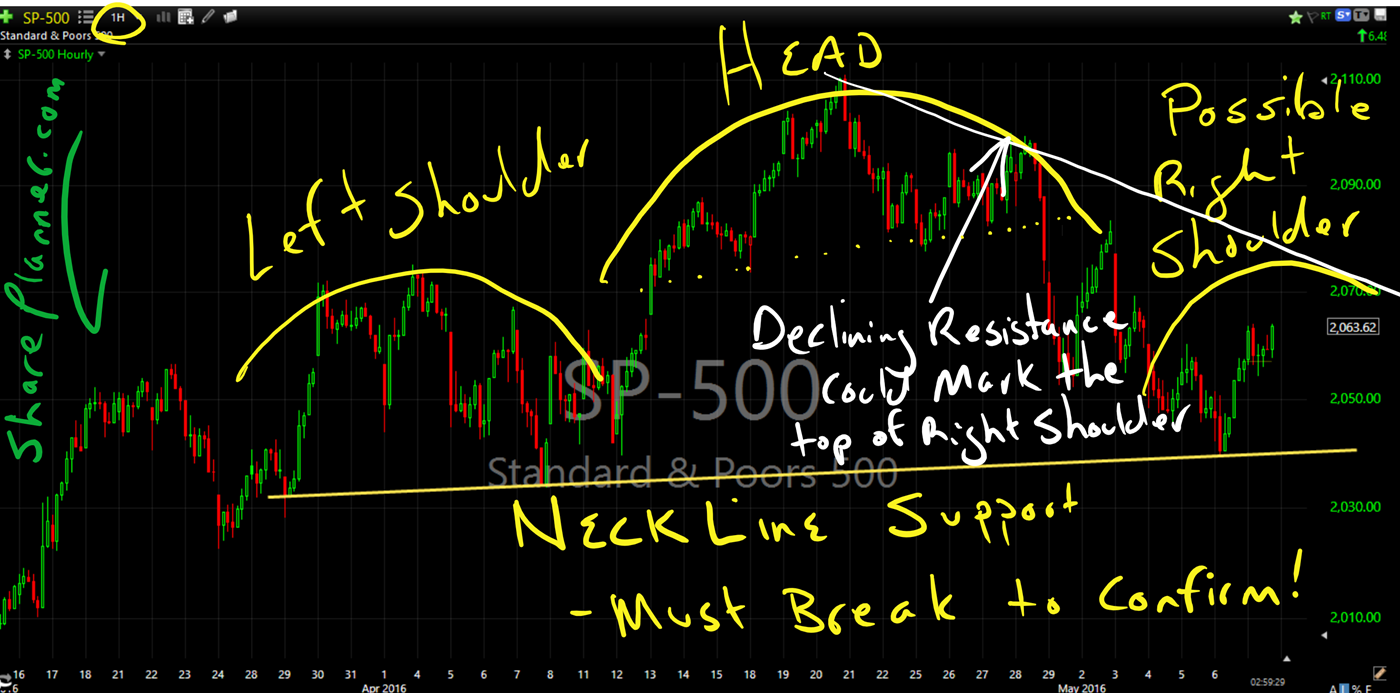
In my opinion the head and shoulders pattern is one of the most reliable topping patterns out there. Much more so then bullish engulfing patterns, or dojis, cup and handle patterns, or double bottoms. That is because the head and shoulders pattern represents the changing thought process in the stock market over an extended period

spc@shareplanner.com
(904) 800-8420
© Copyright 2025 | SharePlanner Inc. All Rights Reserved.
Disclaimer: The information provided on this website is for educational and informational purposes only. Ryan Mallory and/or SharePlanner are not licensed financial advisors, brokers, or tax professionals. The content on this site should not be considered as financial, investment, tax, or legal advice.
All information and opinions expressed herein are based on sources believed to be accurate and reliable. However, we make no representation or warranty as to their accuracy, completeness, or reliability. Any action you take upon the information on this website is strictly at your own risk.
Past performance is not indicative of future results. Investing involves risk, including the possible loss of principal. All investors should make their own decisions based on their specific investment objectives and financial circumstances.
This site may contain links to external websites that are not provided or maintained by or in any way affiliated with Ryan Mallory and/or SharePlanner. Please note that Ryan Mallory and/or SharePlanner do not guarantee the accuracy, relevance, timeliness, or completeness of any information on these external websites.
By using this website, you agree that Ryan Mallory and/or SharePlanner and any affiliated parties are not responsible for any losses or damages resulting from your use of or reliance on the information provided.
It is strongly recommended that you consult with a qualified professional before making any financial decisions.