Currently Rally Losing Momentum More action off of the 10-day moving average today on SPX. It is holding strong once again today, with another solid bounce. You can make the case that the market is in a mind numbing bull flag pattern that has lasted longer than the rally itself that started back
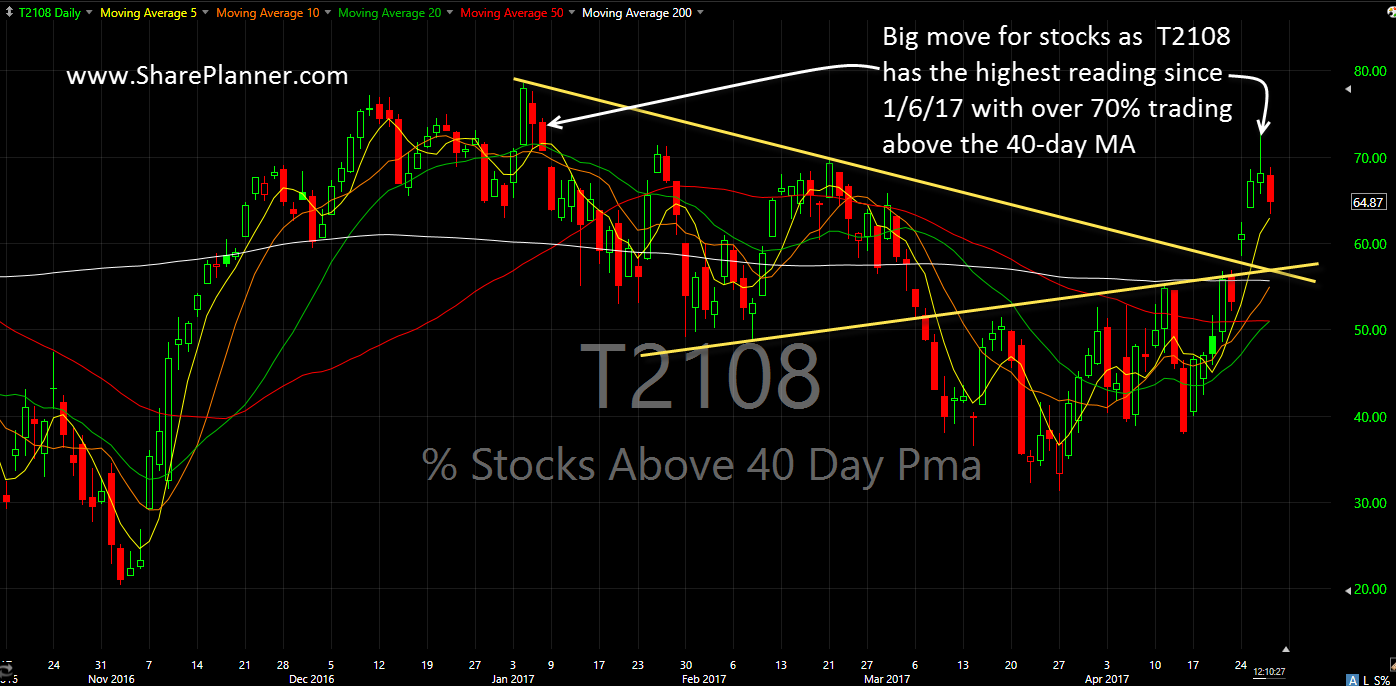
Take a look at one of my favorite stock market indicators I haven’t done a post exclusively on the T2108 in a long time, so I thought today would be a good day to do exactly that as the market has put together a very nice week so far and warrants a review of the
SharePlanner Reversal Indicator came through like a charm Last week I was stating that the SharePlanner Reversal Indicator was more than likely going to make a move to the upside and the SPRI was already forecasting the move. And that is exactly what it did. The proof was in the pudding when the bears had
Market not trending the way reversal signal suggests it should The SharePlanner Reversal Indicator flashed a bullish reversal signal about a week and a half ago, but nothing has really materialized from it. Instead, every attempt at a rally quickly falls apart and closes at or below break even for the day. Despite the lack
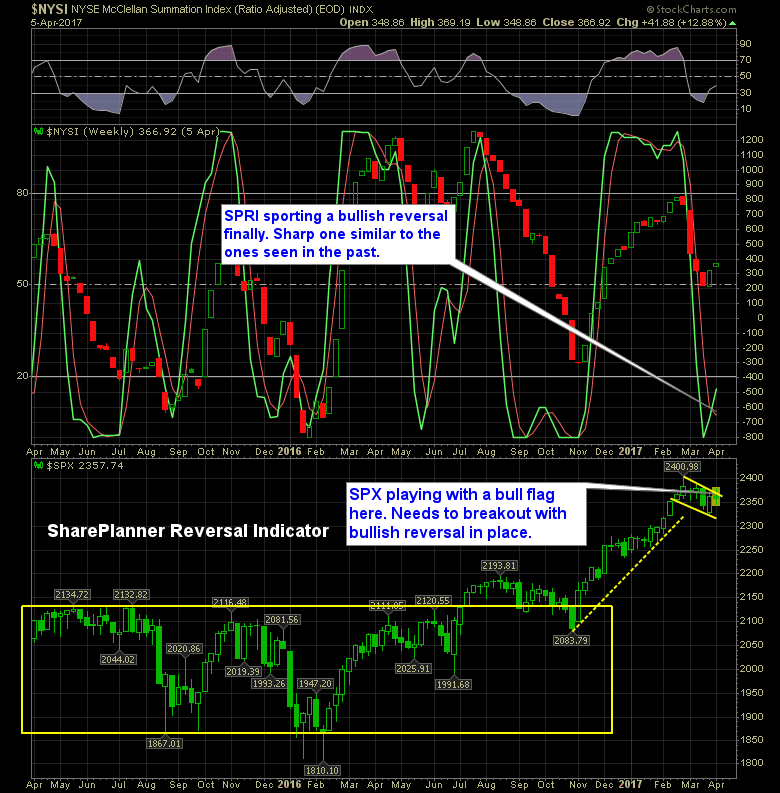
Bullish Trend Reversal Signaled In somewhat of a surprising development following yesterday's hard sell off from the day's highs, the bulls are managing to put together a bullish trend reversal on the SharePlanner Reversal Indicator. That's actually quite impressive considering where the market has been over the past few weeks. Needless to say, unless the
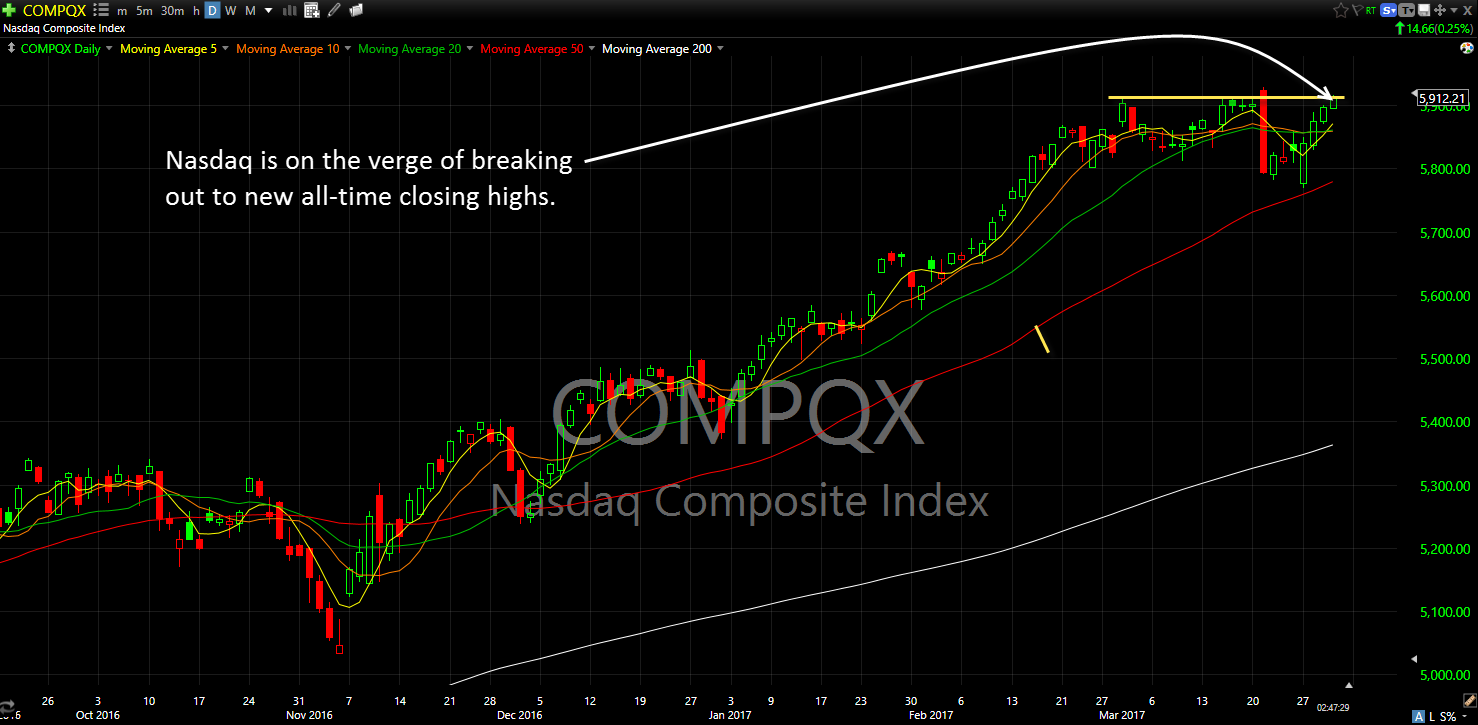
The Nasdaq Close was based on closing price not intraday all-time highs. That close for the Nasdaq is a good thing for the bulls and the rest of the market, because the Nasdaq has been leading the way for the past few months. And by hitting new closing highs, it increases the odds that the
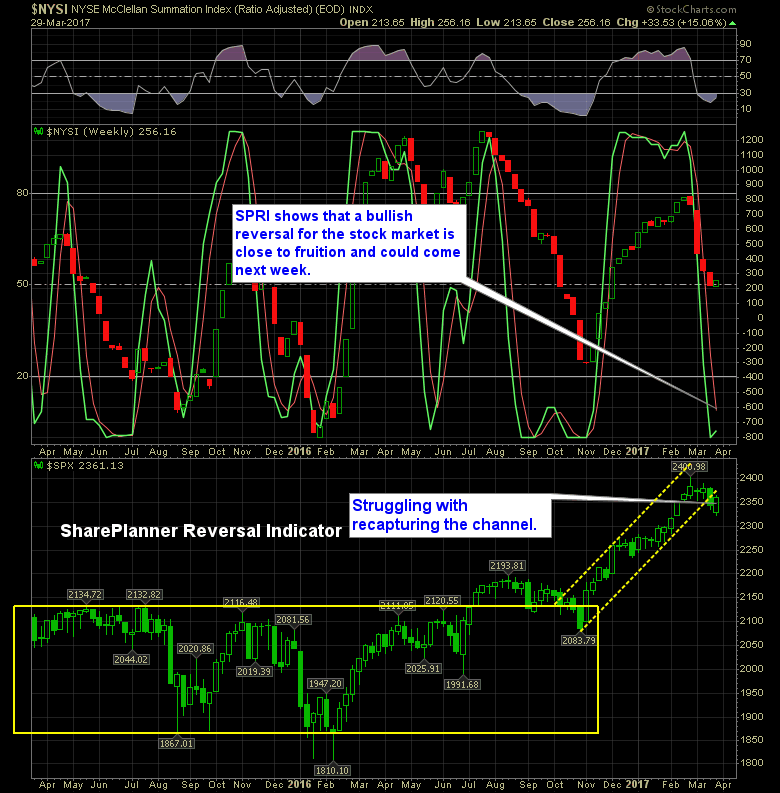
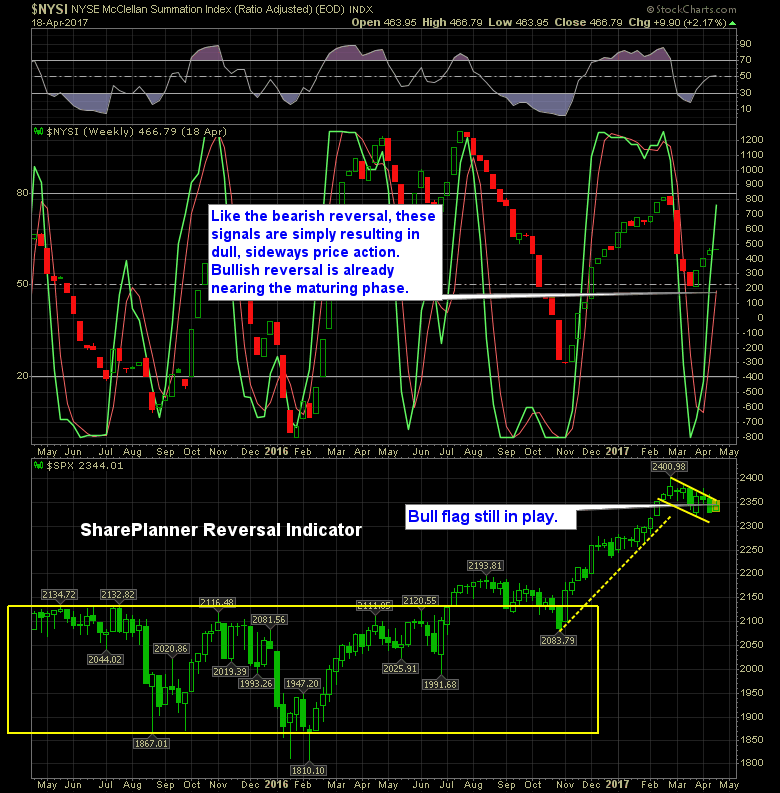
Reversal Indicator closing in on a bullish reading While the current state of the SharePlanner Reversal Indicator is trending bearish, this week’s reading shows that the bearish jitters the market has been experiencing of late could be coming to an end very soon. In fact, when you take a look at the reversal indicator below,
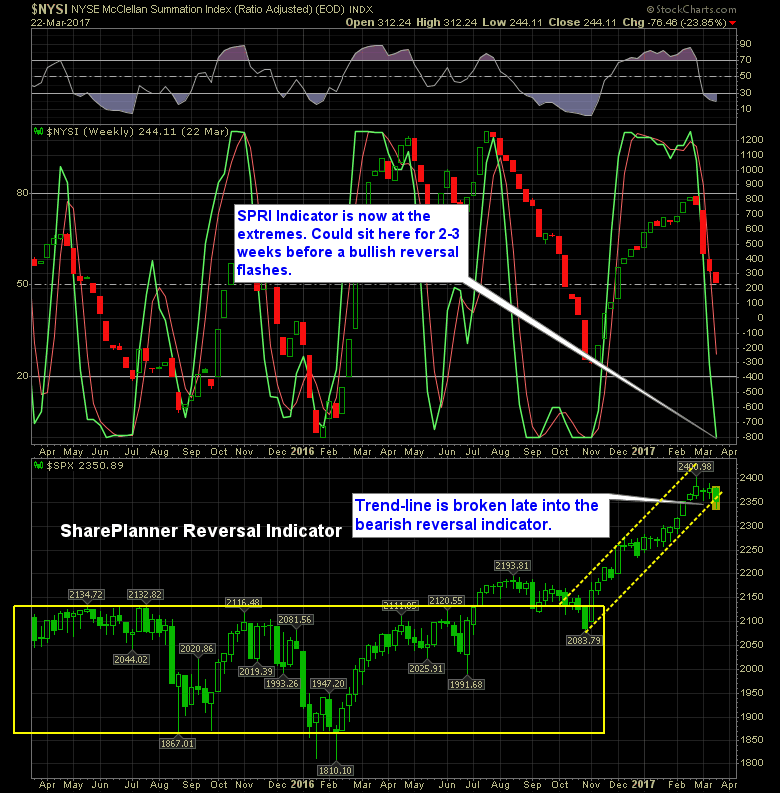
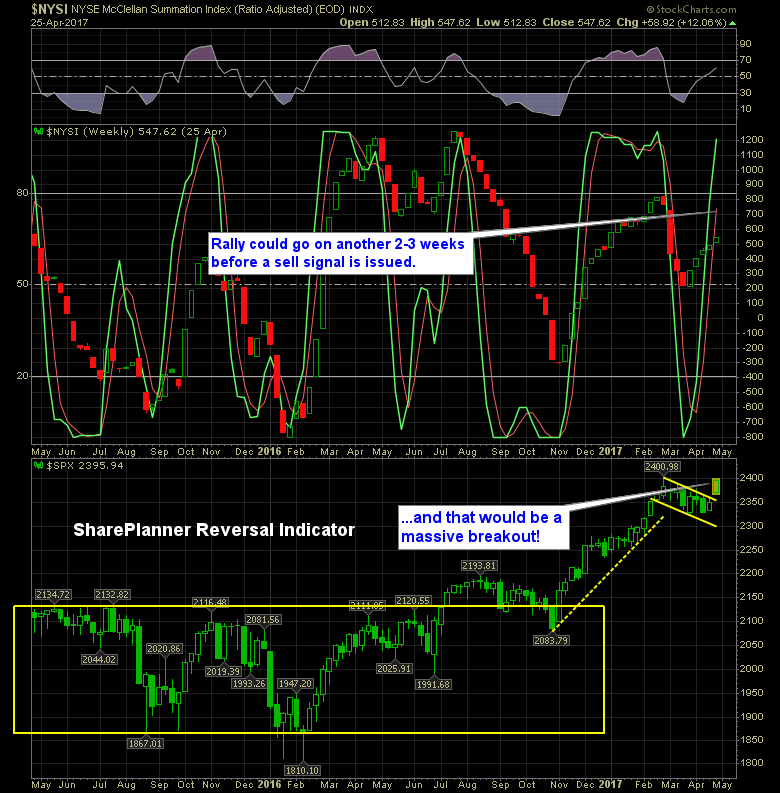
SharePlanner's Trend Reversal Indicator hitting extremes here Over the past 8 years of the bull rally, just reaching a bearish extreme has been, in large part, a difficult task to pull off. But we have that now, and the bearish trend reversal indicator, from a textbook standpoint, should hover here for 2-3 weeks, but recent
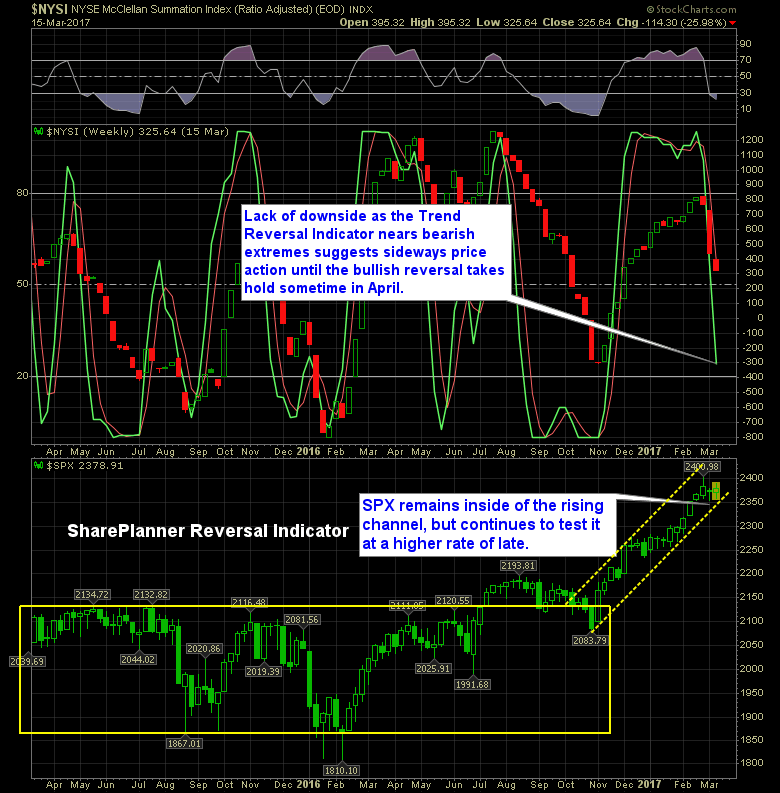
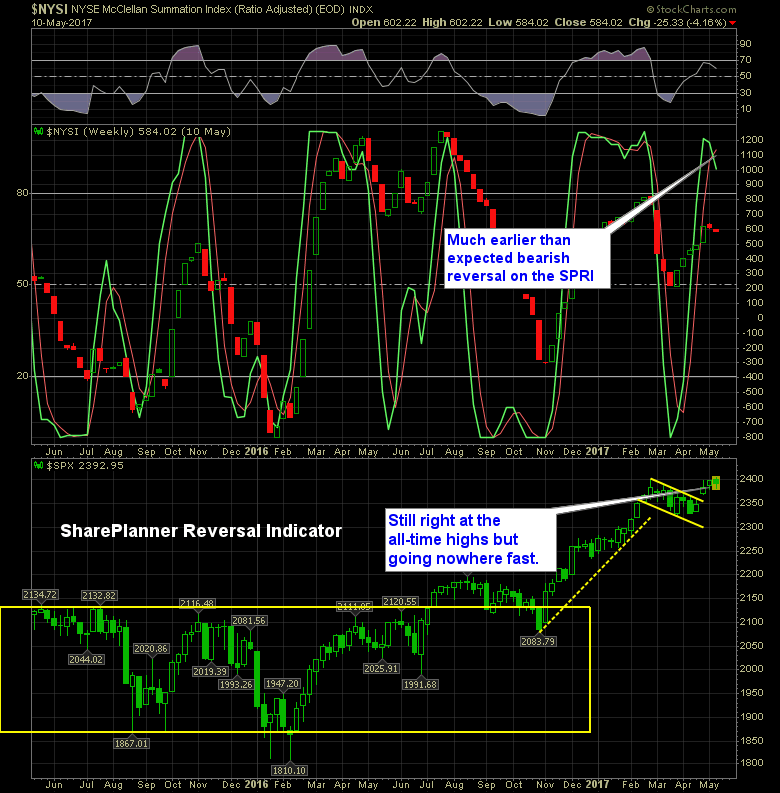
Looking For a Selloff That’ll Never Come About Bearish reversal was triggered on the SharePlanner Trend Reversal indicator a few weeks ago, but instead of a selloff, which most of us would come to expect, we are instead seeing nothing more than sideways to slightly downward price action.

Fed Announcement by Janet Yellen Hikes Interest Rates Again Below is the Fed announcement and the FOMC Statement regarding the 0.25% interest rate hike: Information received since the Federal Open Market Committee met in February indicates that the labor market has continued to strengthen and that economic activity has continued to expand at a moderate

spc@shareplanner.com
(904) 800-8420
© Copyright 2025 | SharePlanner Inc. All Rights Reserved.
Disclaimer: The information provided on this website is for educational and informational purposes only. Ryan Mallory and/or SharePlanner are not licensed financial advisors, brokers, or tax professionals. The content on this site should not be considered as financial, investment, tax, or legal advice.
All information and opinions expressed herein are based on sources believed to be accurate and reliable. However, we make no representation or warranty as to their accuracy, completeness, or reliability. Any action you take upon the information on this website is strictly at your own risk.
Past performance is not indicative of future results. Investing involves risk, including the possible loss of principal. All investors should make their own decisions based on their specific investment objectives and financial circumstances.
This site may contain links to external websites that are not provided or maintained by or in any way affiliated with Ryan Mallory and/or SharePlanner. Please note that Ryan Mallory and/or SharePlanner do not guarantee the accuracy, relevance, timeliness, or completeness of any information on these external websites.
By using this website, you agree that Ryan Mallory and/or SharePlanner and any affiliated parties are not responsible for any losses or damages resulting from your use of or reliance on the information provided.
It is strongly recommended that you consult with a qualified professional before making any financial decisions.