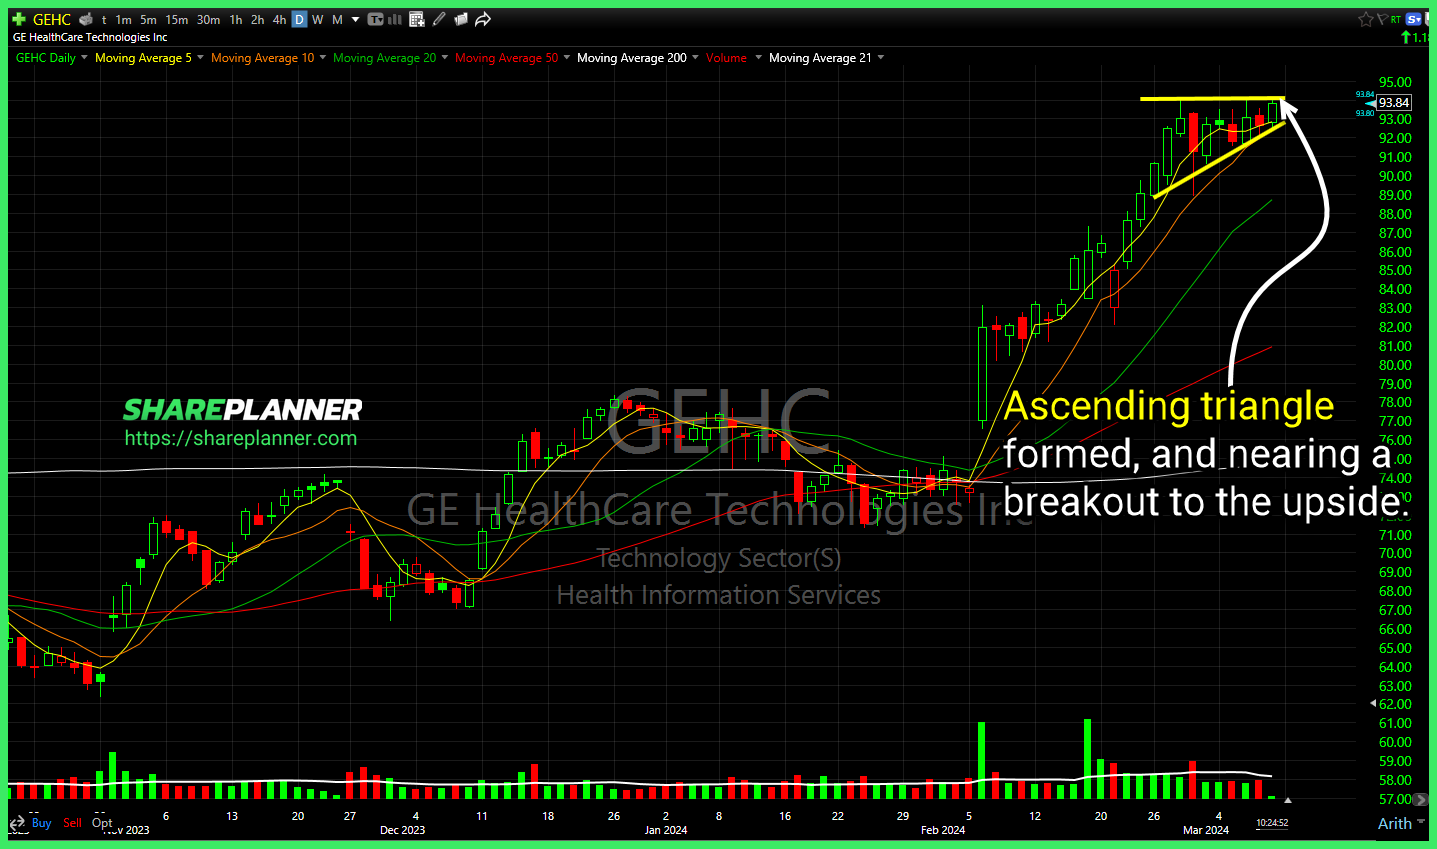
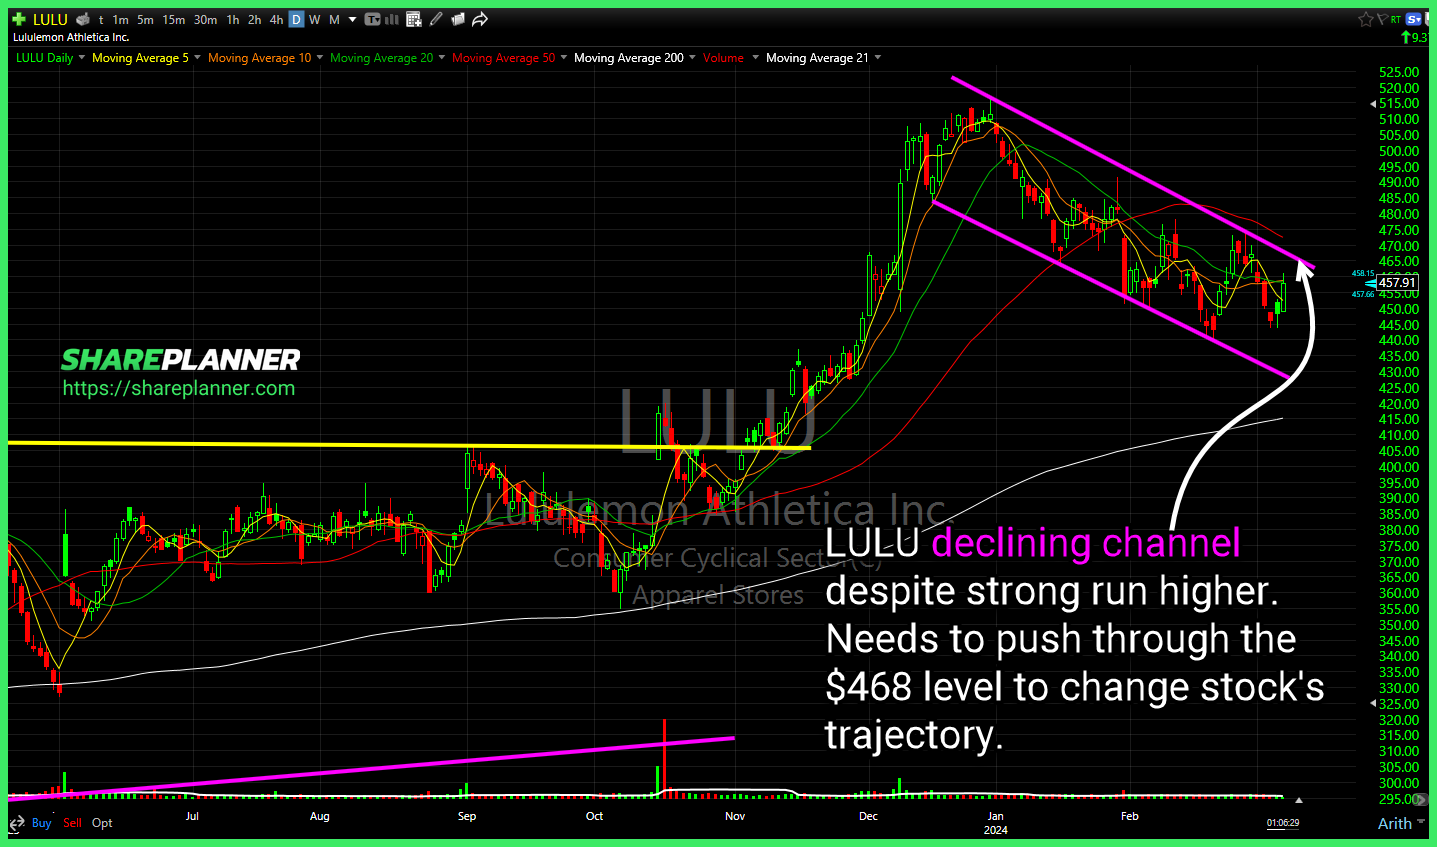
Lululemon Athletica (LULU) declining channel despite strong run higher. Needs to push through the $468 level to change stock's trajectory. Sunrun (RUN) attempting to breakout of the triangle. However, heavy price level resistance is pushing back on the stock here, and could see a break lower instead. Jacobs Solutions (J) ascending triangle pattern setting up
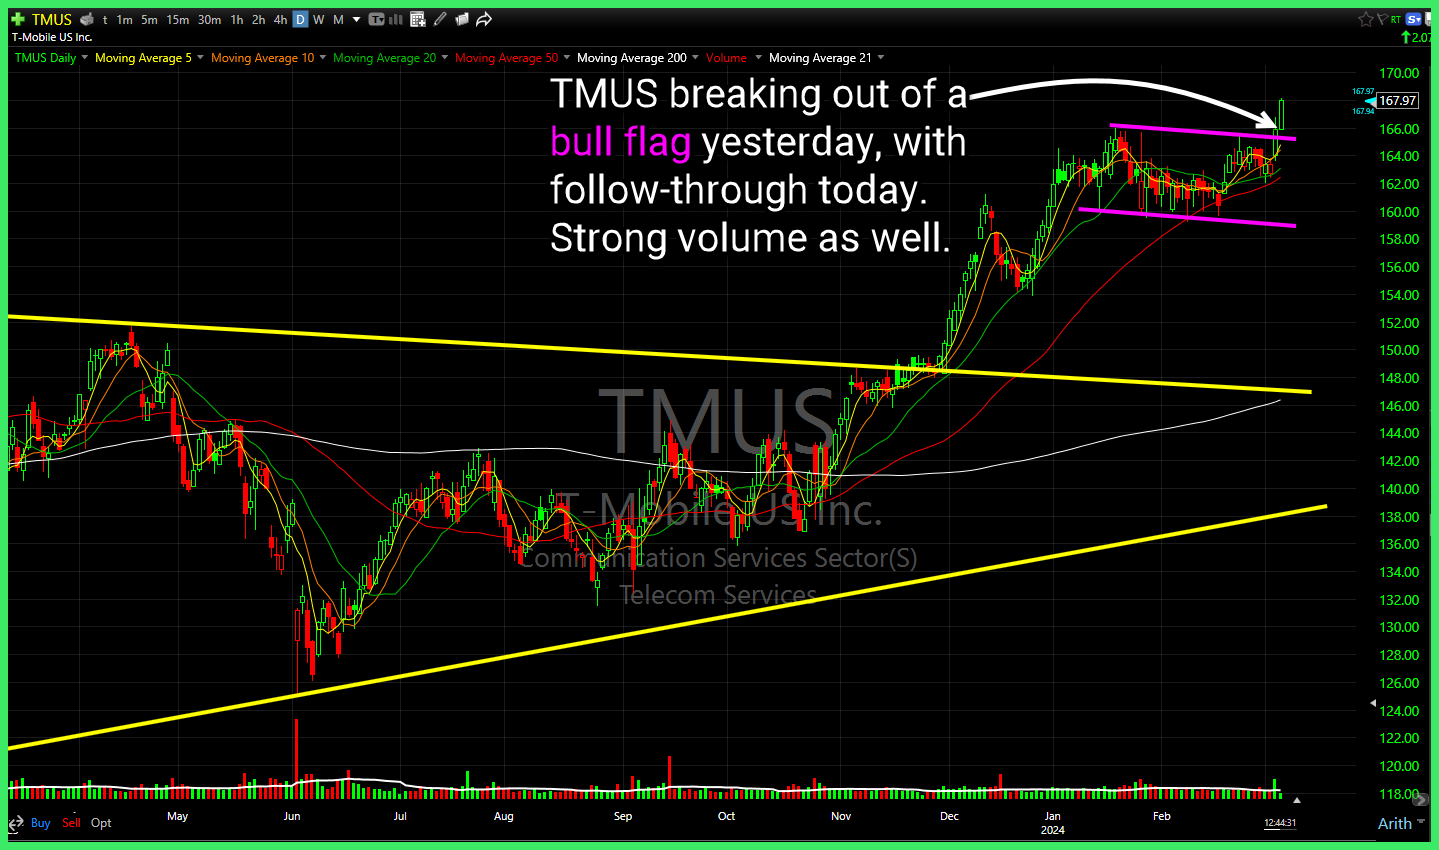
T-Mobile (TMUS) breaking out of a bull flag yesterday, with follow-through today. Strong volume as well. MedPace (MEDP) ascending triangle breakout, right after the opening bell. ZipRecruiter (ZIP) head and shoulders confirmed, continuation triangle pattern forming with a break to the downside today. Palantir Technologies (PLTR) holding the channel breakout from last month, and now

Possible that $FSLR breaks out of that base here. Very volatile and wild stock for swing trading at times. . $SPY attempting to set the stage for an end of day rally with this inverse head and shoulders forming. $CMC solid bounce off of the trend-line, with potential room to run up to resistance at
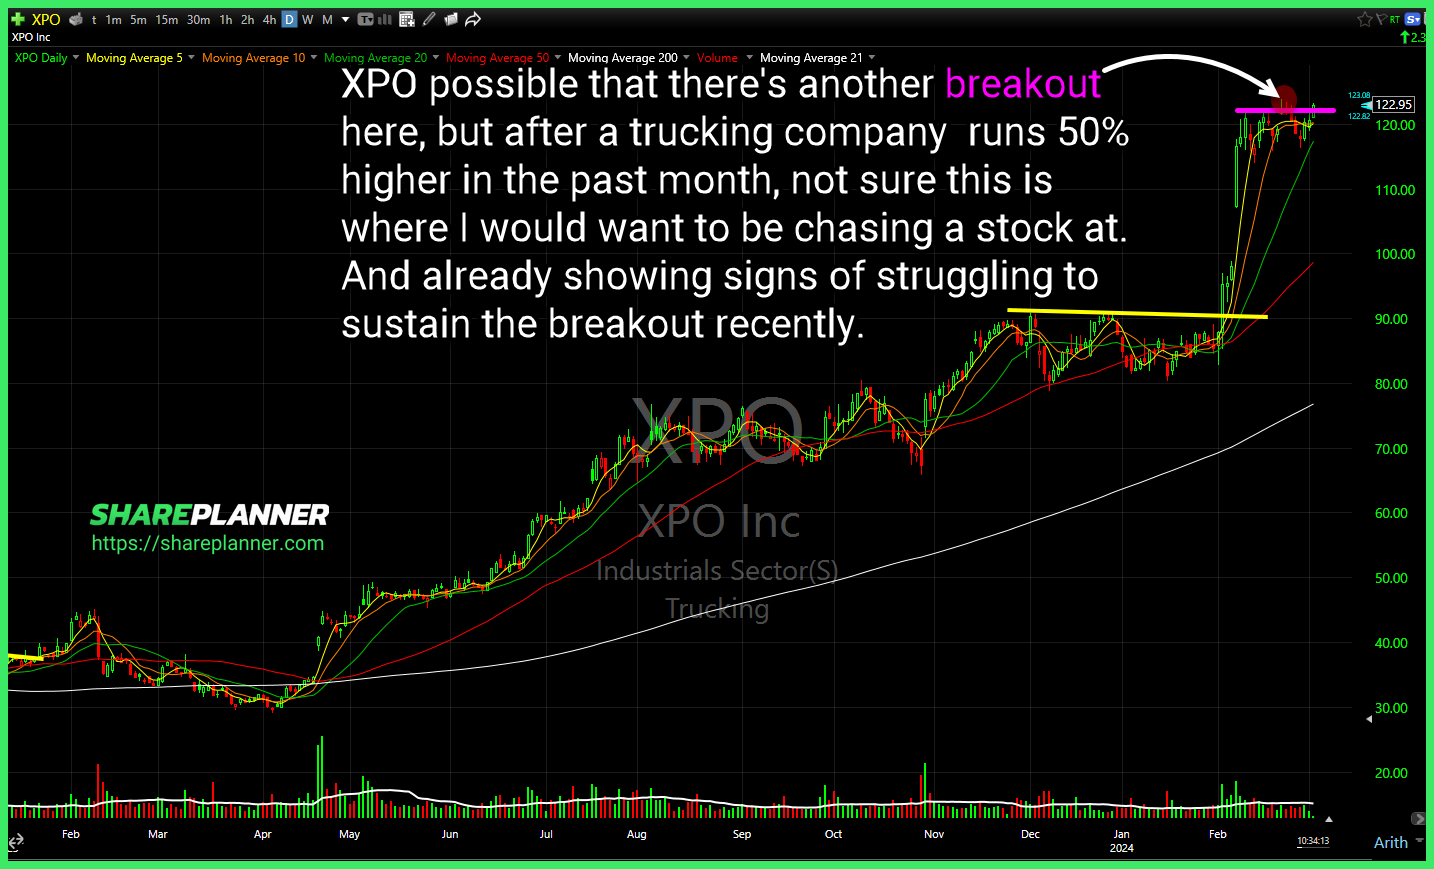
XPO (XPO) possible that there's another breakout here, but after a trucking company runs 50% higher in the past month, not sure this is where I would want to be chasing a stock at. And already showing signs of struggling to sustain the breakout recently. Major break in resistance on Friday for SPDR Gold ETF
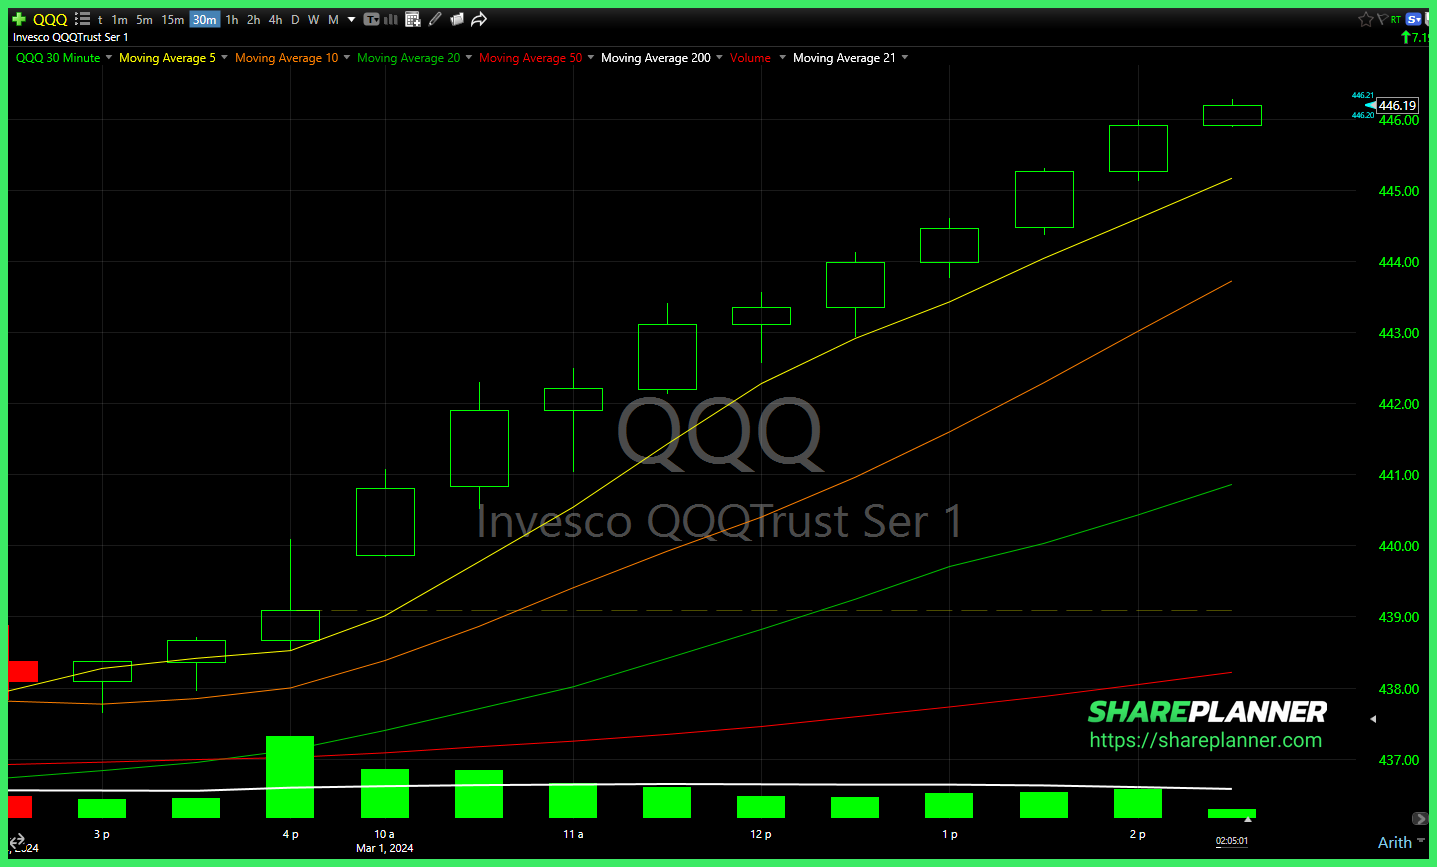
Nasdaq 100 (QQQ) 30 min chart will zero chill in it. Another breakout attempt unfolding on Russell 2000 (IWM) today. A solid push through resistance so far. If US Global Jets ETF (JETS) breaks out of the continuation triangle, then it has to immediately contend with long-term declining resistance. A no-go for me. Heavy resistance

$VIRT broke out of the base and through the declining trend-line. . $IWM gapped above resistance today, and has since pulled back for a retest. Watching here to see whether that level holds, or if it starts to fade and close the gap from this morning. Bull flag in $WYNN attempting to breakout. Rising trend-line
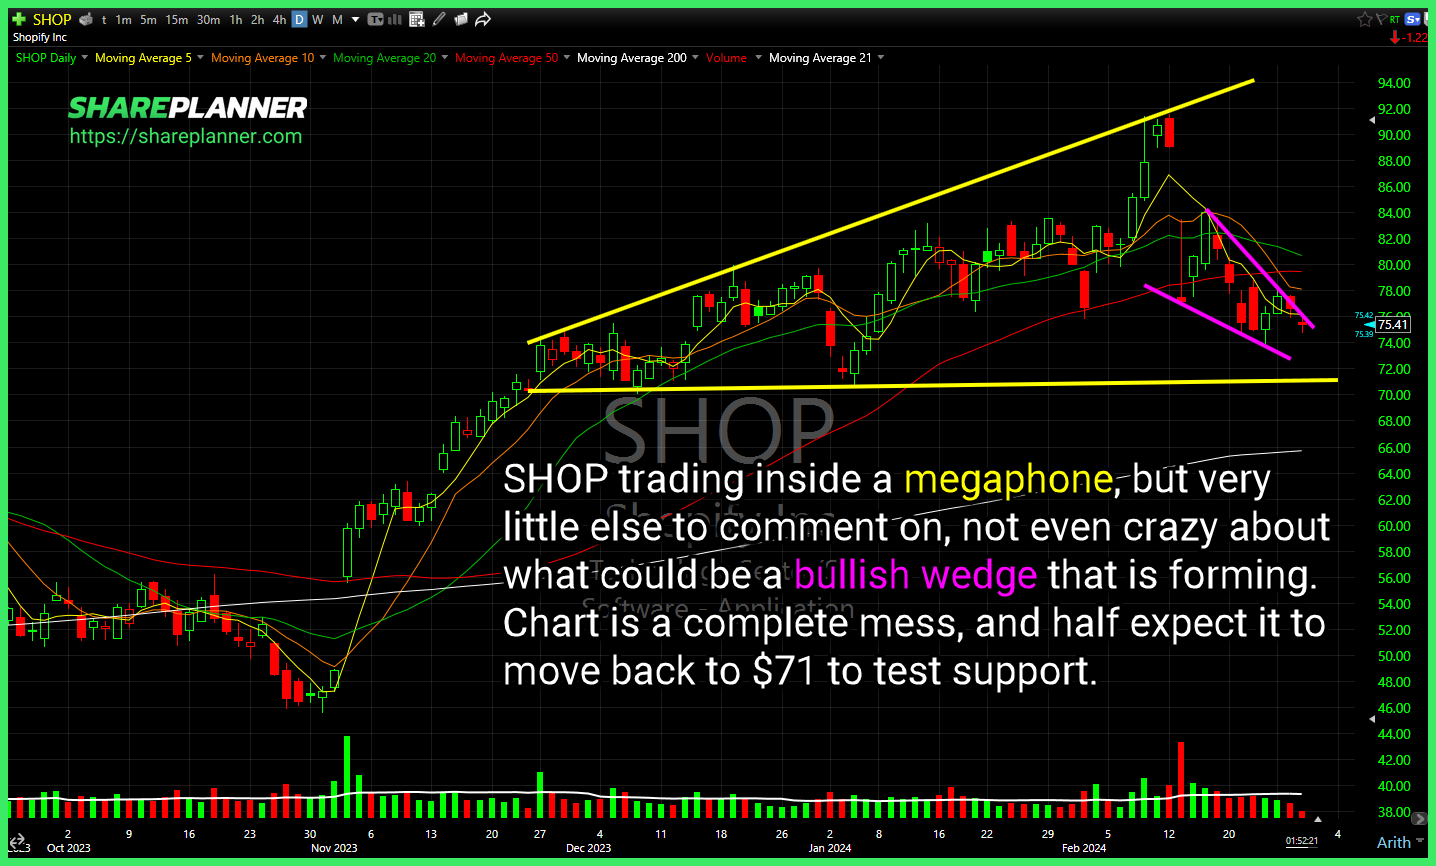
$SHOP trading inside a megaphone, but very little else to comment on, not even crazy about what could be a bullish wedge that is forming. Chart is a complete mess, and half expect it to move back to $71 to test support. . $XLV pulling back to the rising trend-line from the October lows. Potential
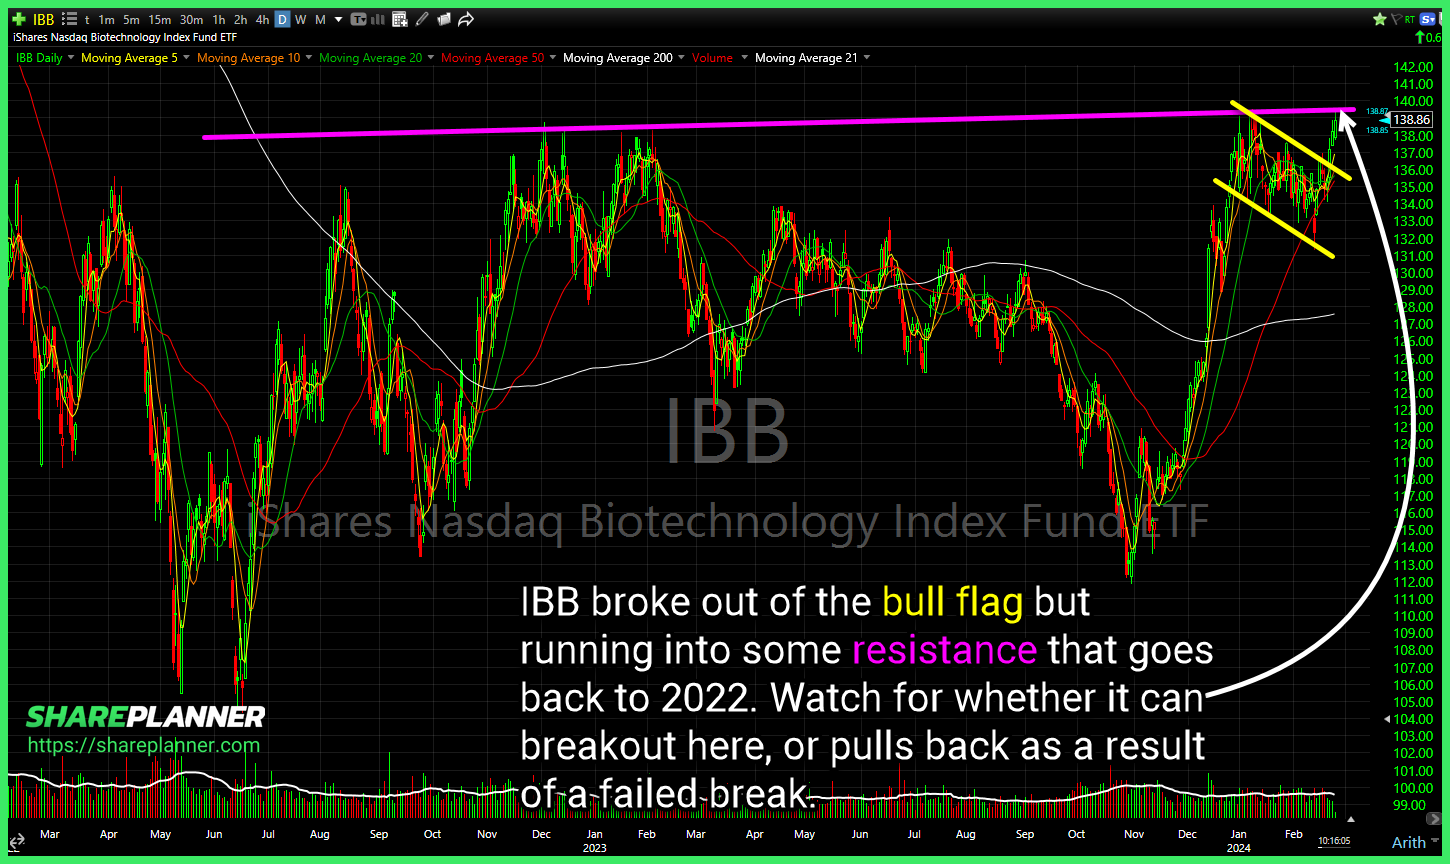
$IBB broke out of the bull flag but running into some resistance that goes back to 2022. Watch for whether it can breakout here, or pulls back as a result of a failed break. . $IBIT bull flag breakout here, representing a continuation of the current trend-line off of the January lows.
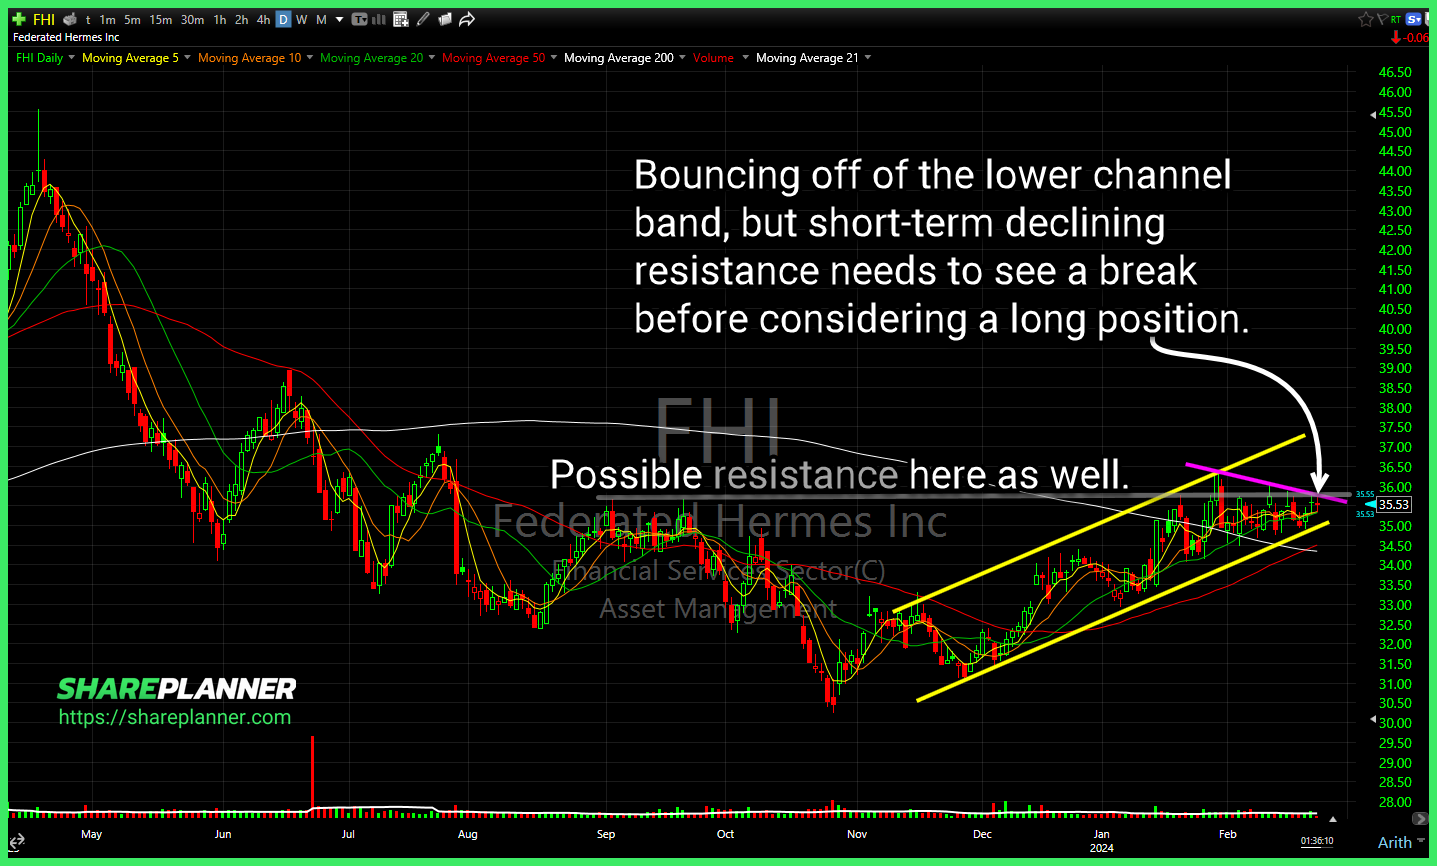
$FHI bouncing off of the lower channel band, but short-term declining resistance needs to see a break before considering a long position. . $VSCO bull flag pattern nearing a breakout to the upside. A break below declining support would invalidate the setup. $SMH has a complicated history with bollinger bands and here the reward gets

spc@shareplanner.com
(904) 800-8420
© Copyright 2025 | SharePlanner Inc. All Rights Reserved.
Disclaimer: The information provided on this website is for educational and informational purposes only. Ryan Mallory and/or SharePlanner are not licensed financial advisors, brokers, or tax professionals. The content on this site should not be considered as financial, investment, tax, or legal advice.
All information and opinions expressed herein are based on sources believed to be accurate and reliable. However, we make no representation or warranty as to their accuracy, completeness, or reliability. Any action you take upon the information on this website is strictly at your own risk.
Past performance is not indicative of future results. Investing involves risk, including the possible loss of principal. All investors should make their own decisions based on their specific investment objectives and financial circumstances.
This site may contain links to external websites that are not provided or maintained by or in any way affiliated with Ryan Mallory and/or SharePlanner. Please note that Ryan Mallory and/or SharePlanner do not guarantee the accuracy, relevance, timeliness, or completeness of any information on these external websites.
By using this website, you agree that Ryan Mallory and/or SharePlanner and any affiliated parties are not responsible for any losses or damages resulting from your use of or reliance on the information provided.
It is strongly recommended that you consult with a qualified professional before making any financial decisions.