
Tesla (TSLA) pullback and bounce off of the base breakout level. Airbnb (ABNB) wedge pattern formed that could provide some short-term resistance for ABNB, which trades inside of a much bigger channel pattern. Dollar General (DG) pulling back to breakout support. So far holding it. Will need a hard bounce here to keep the setup
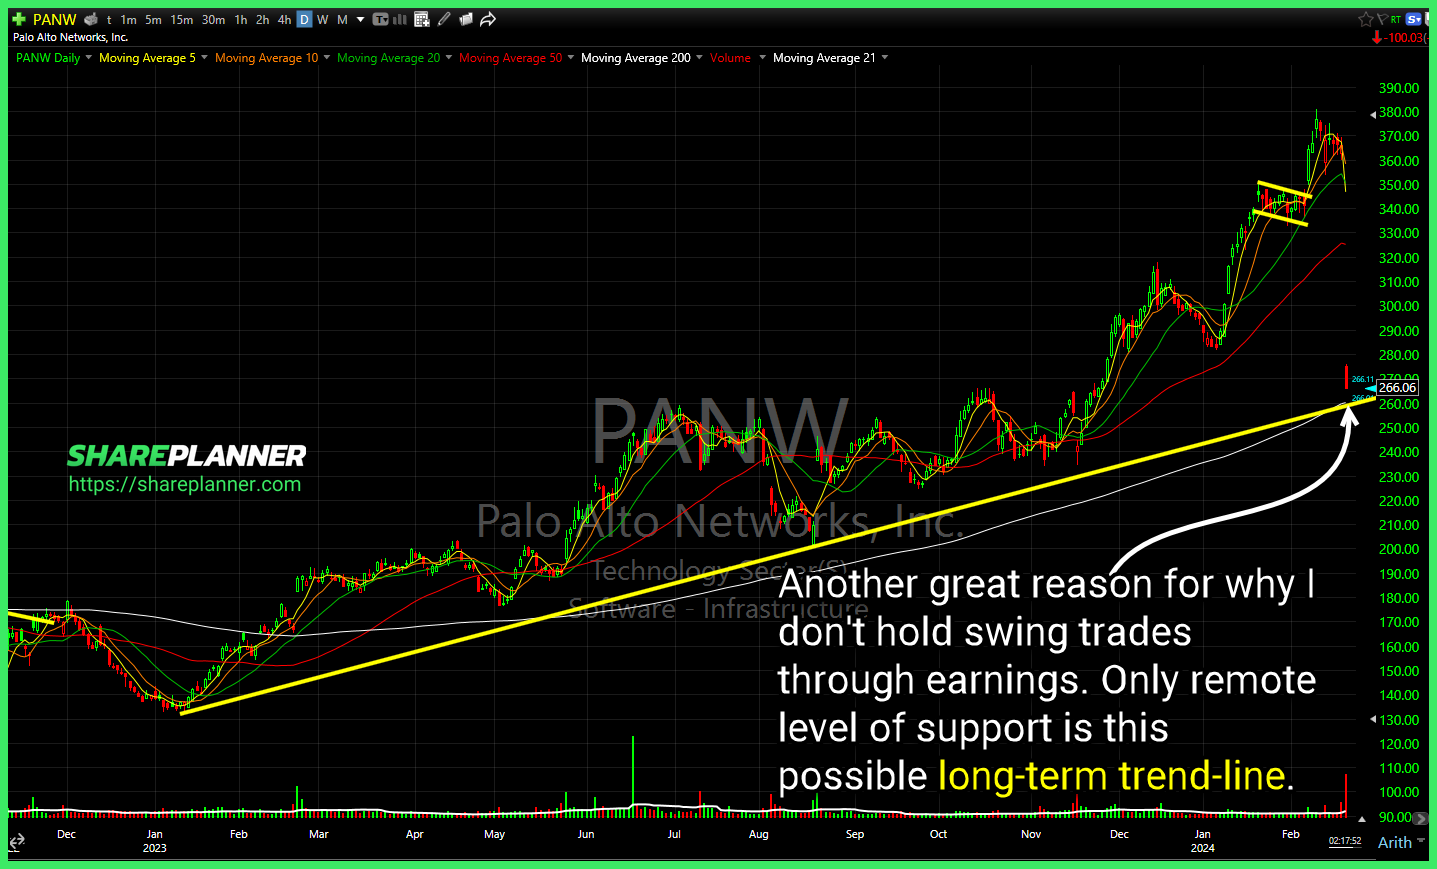
PANW - Another great reason for why I don't hold swing trades through earnings. Only remote level of support is this possible long-term trend-line. AAPL managed to hold the trend-line into the close yesterday, and now attempting to bounce off of it today. Possible it sees some push back from the 200-day MA
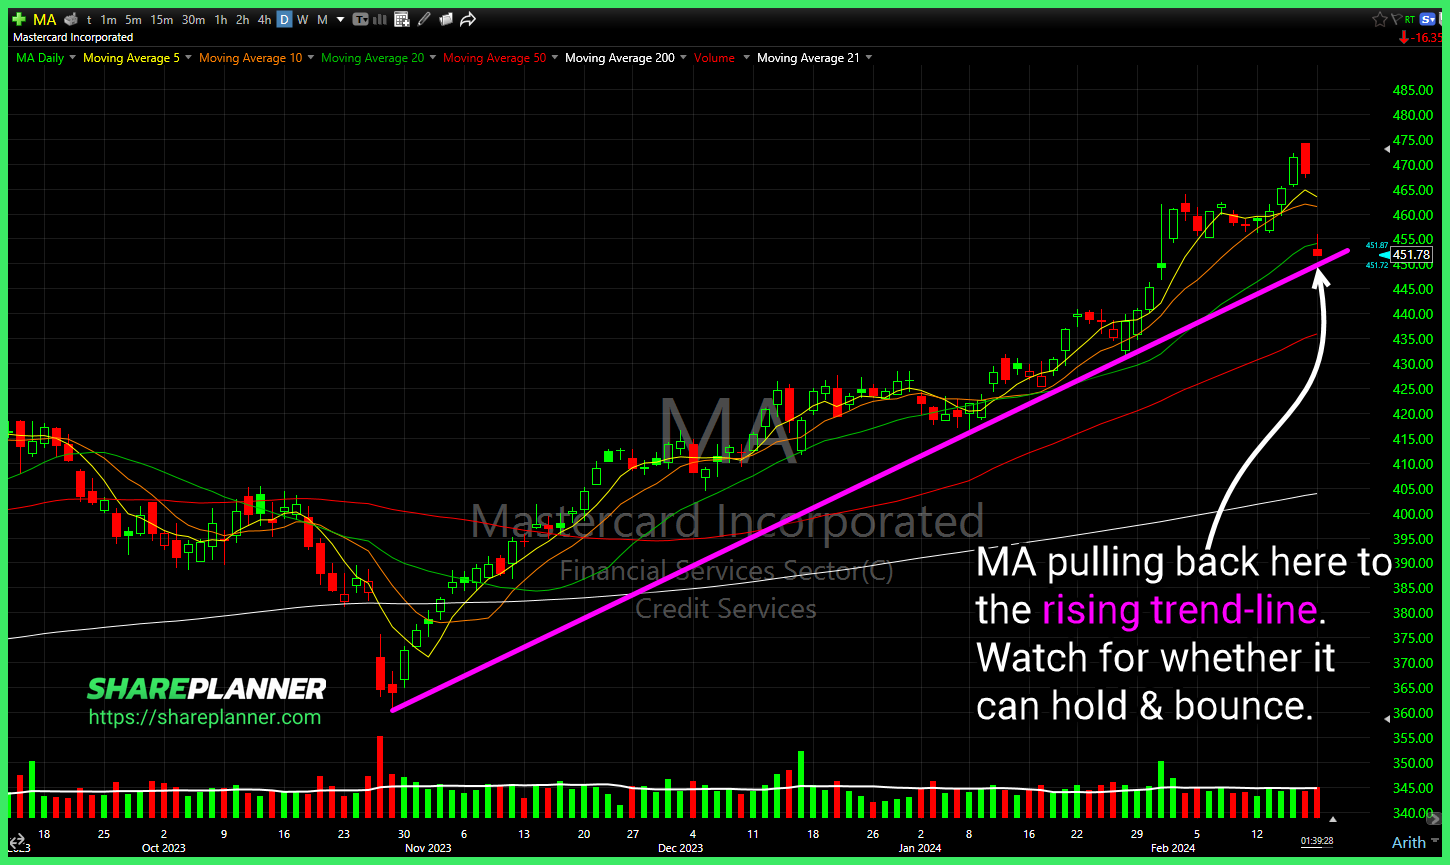
Mastercard (MA) pulling back here to the rising trend-line. Watch for whether it can hold & bounce. . Alphabet (GOOGL) buying the dip off the rising trend-line today.
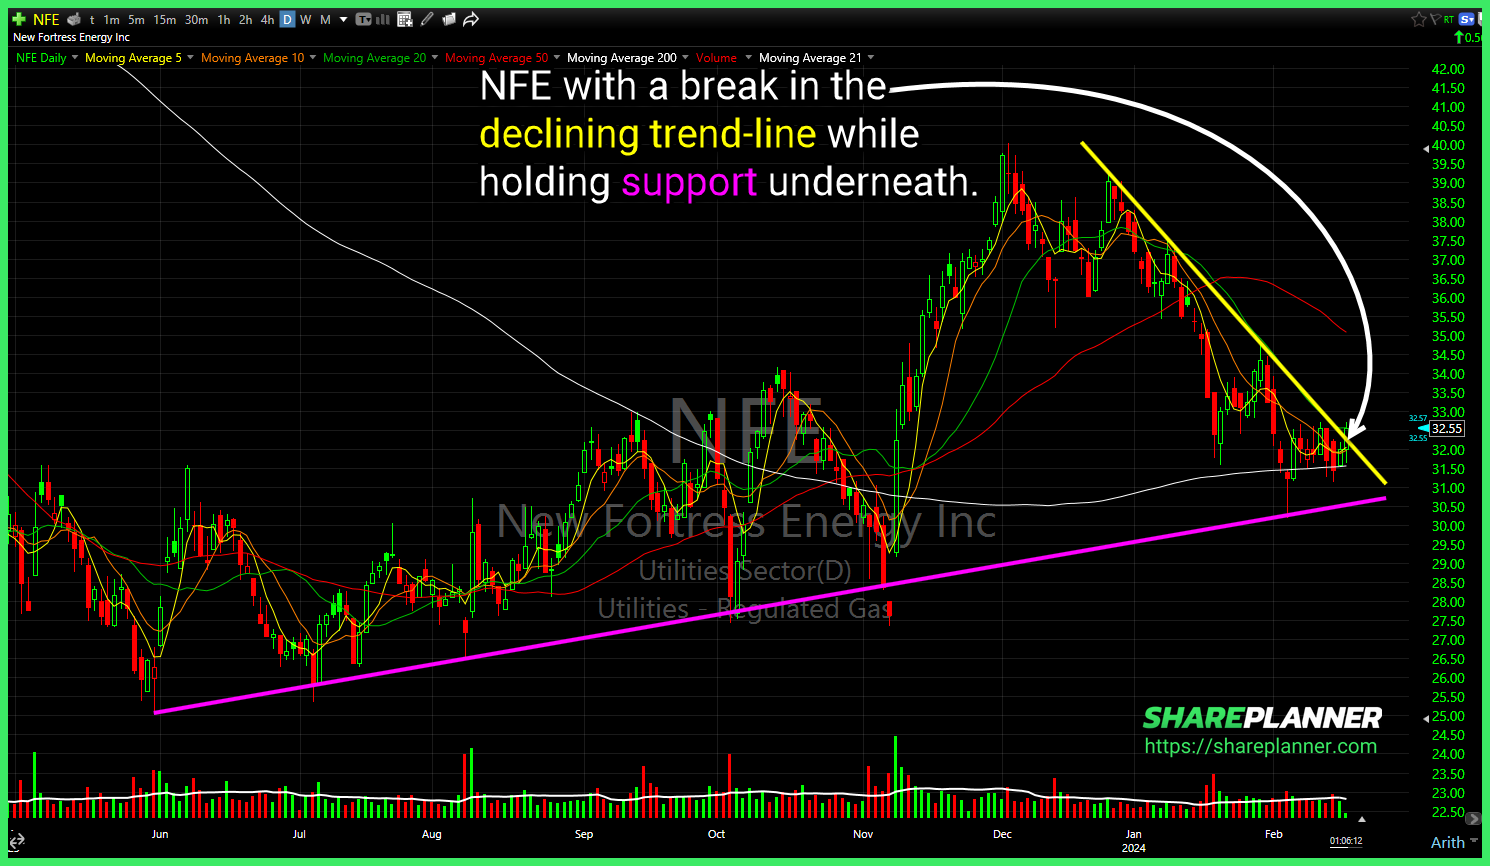
$NFE with a break in the declining trend-line while holding support underneath. . $SMCI with a massive bearish engulfing candle so far today. $HOOD broke through the upper channel band.
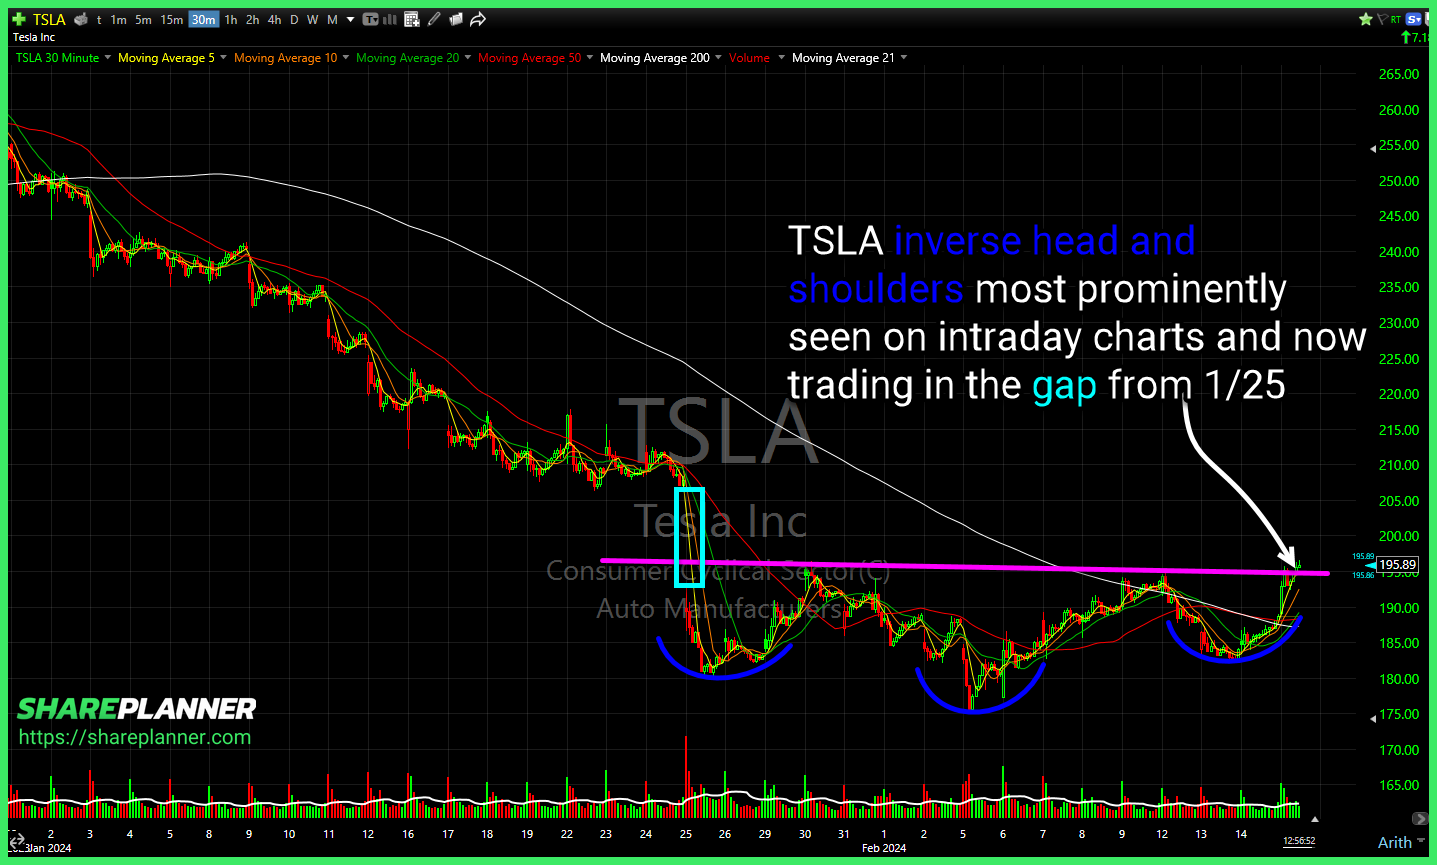
Tesla (TSLA) inverse head and shoulders most prominently seen on intraday charts and now trading in the gap from 1/25 Airbnb (ABNB) with solid short-term rising support underneath, but you want to pay close attention to the resistance above that it isn't part of a bearish wedge that is forming. History often rhymes Super Micro
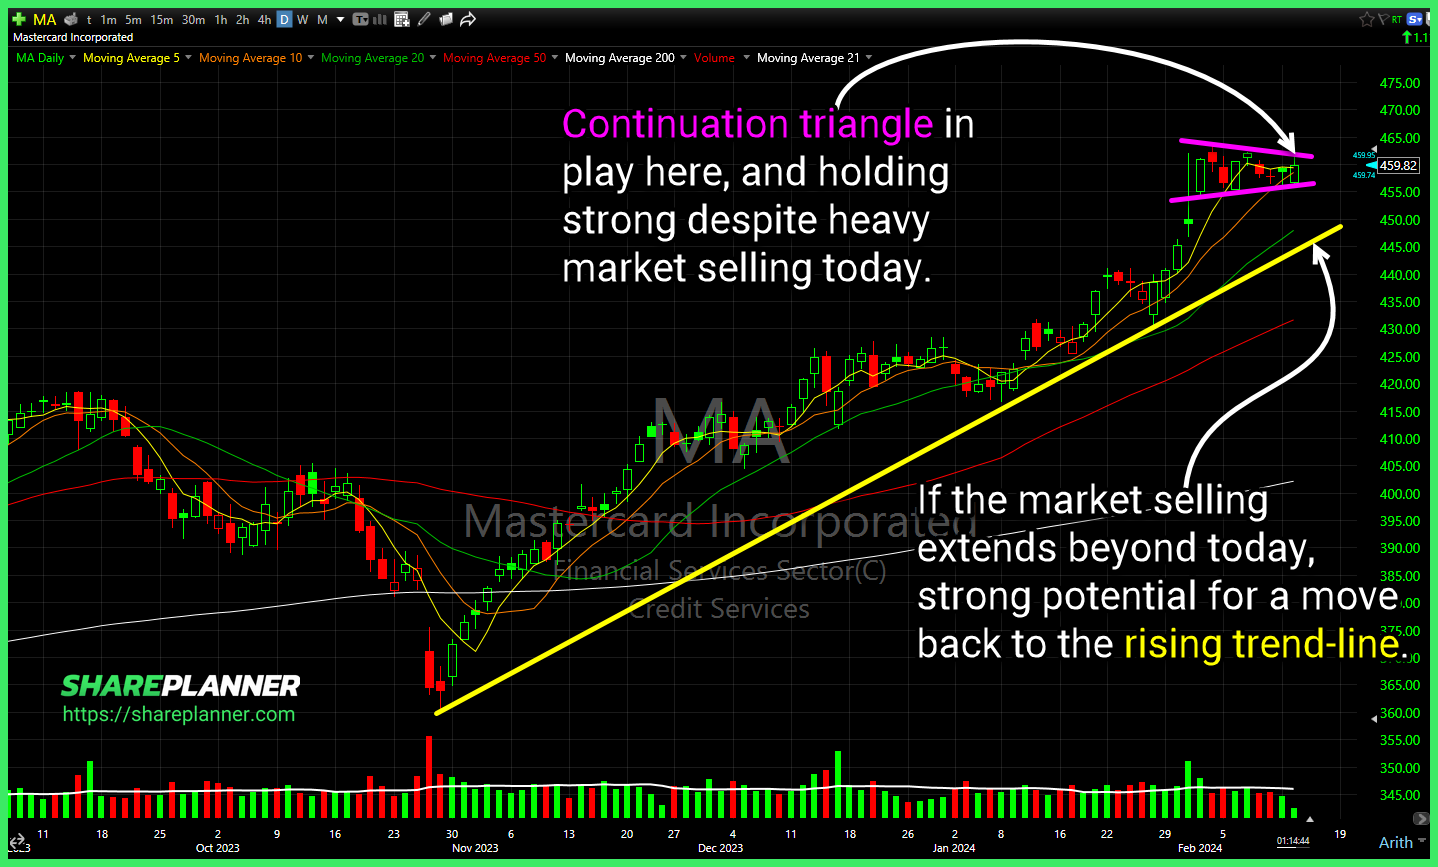
$MA Continuation triangle in play here, and holding strong despite heavy market selling today. . $ALT Inverse cup and handle forming, and testing confirmation here. $JPM bearish wedge formed and testing rising support here. A break below $172.90 would confirm the bearish wedge here.
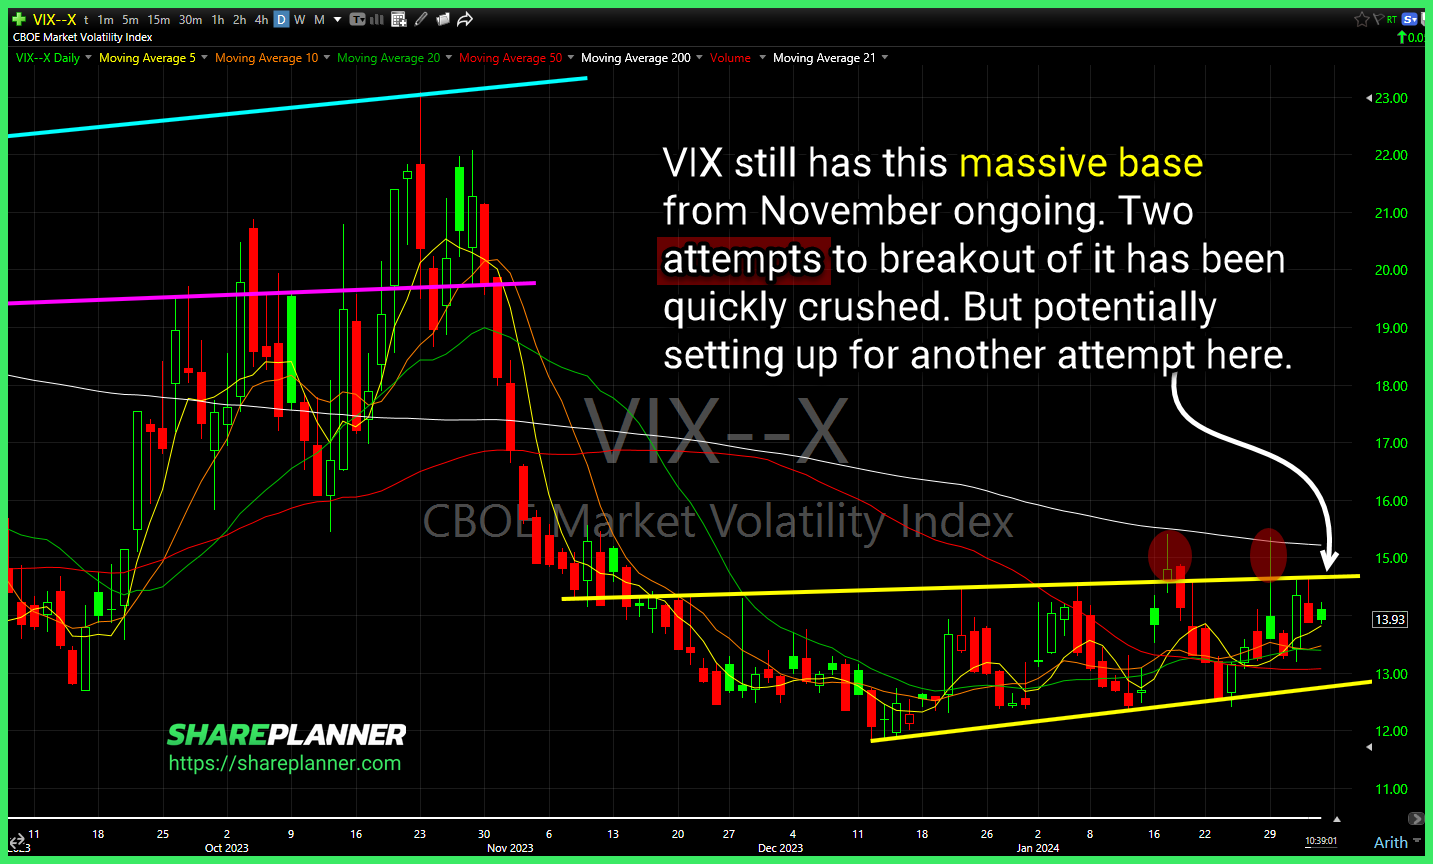
Two day pop out of $VIX following a test of rising support, but still range bound and doesn't mean much in terms of future direction. . $AI descending triangle breakout, following a non-stop, 25% move off the lows of the pattern, making it a difficult one to tightly manage the risk on. Double top on
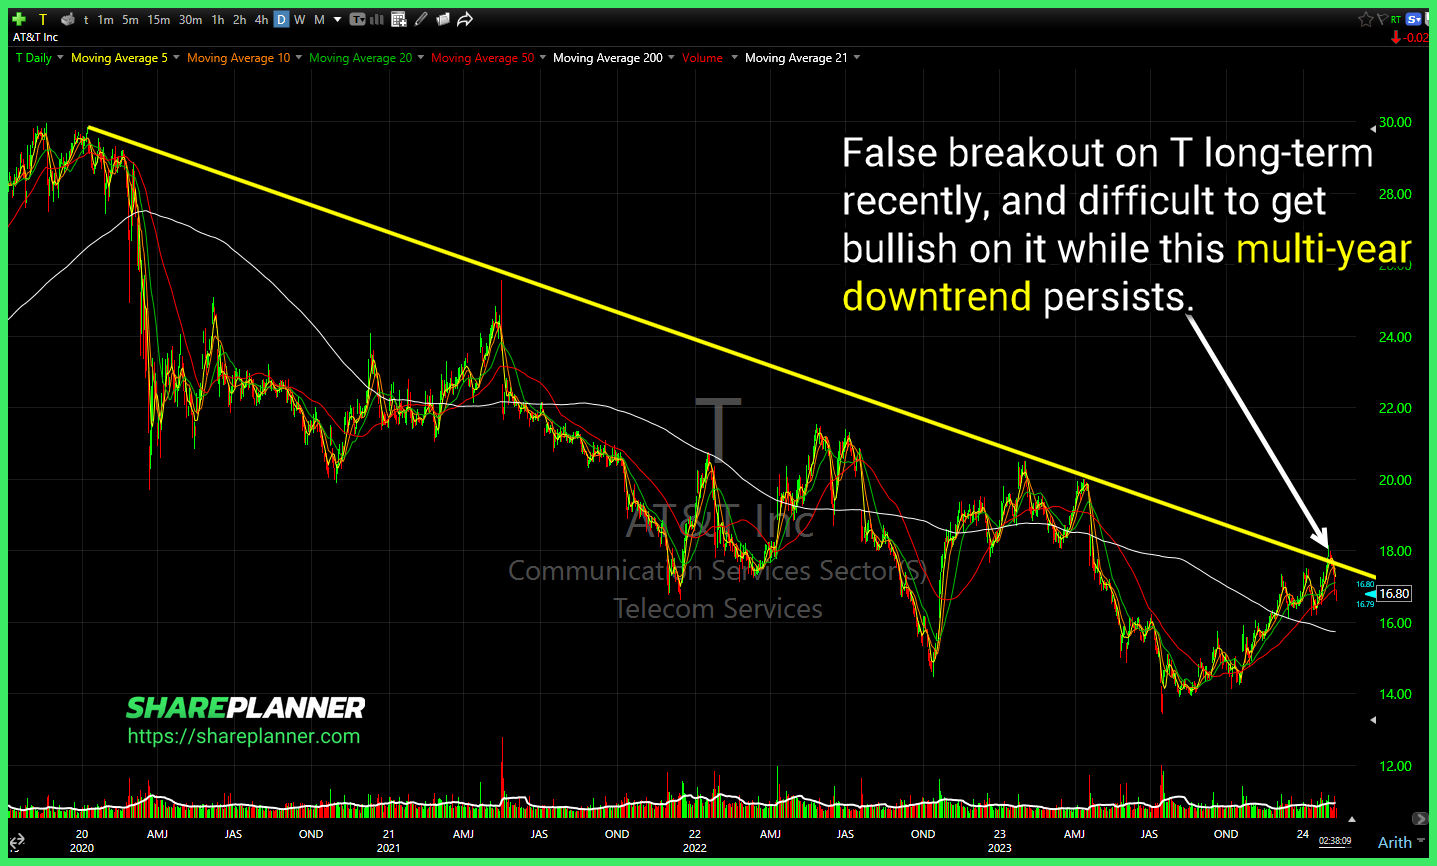
False breakout on $T long-term recently, and difficult to get bullish on it while this multi-year downtrend persists. . $AMGN pullback looking to test support at $285, watch for whether it can base and bounce. Possible $GEO finds support at the rising trend-line, which still has room to fall before testing, but heavy volume pouring
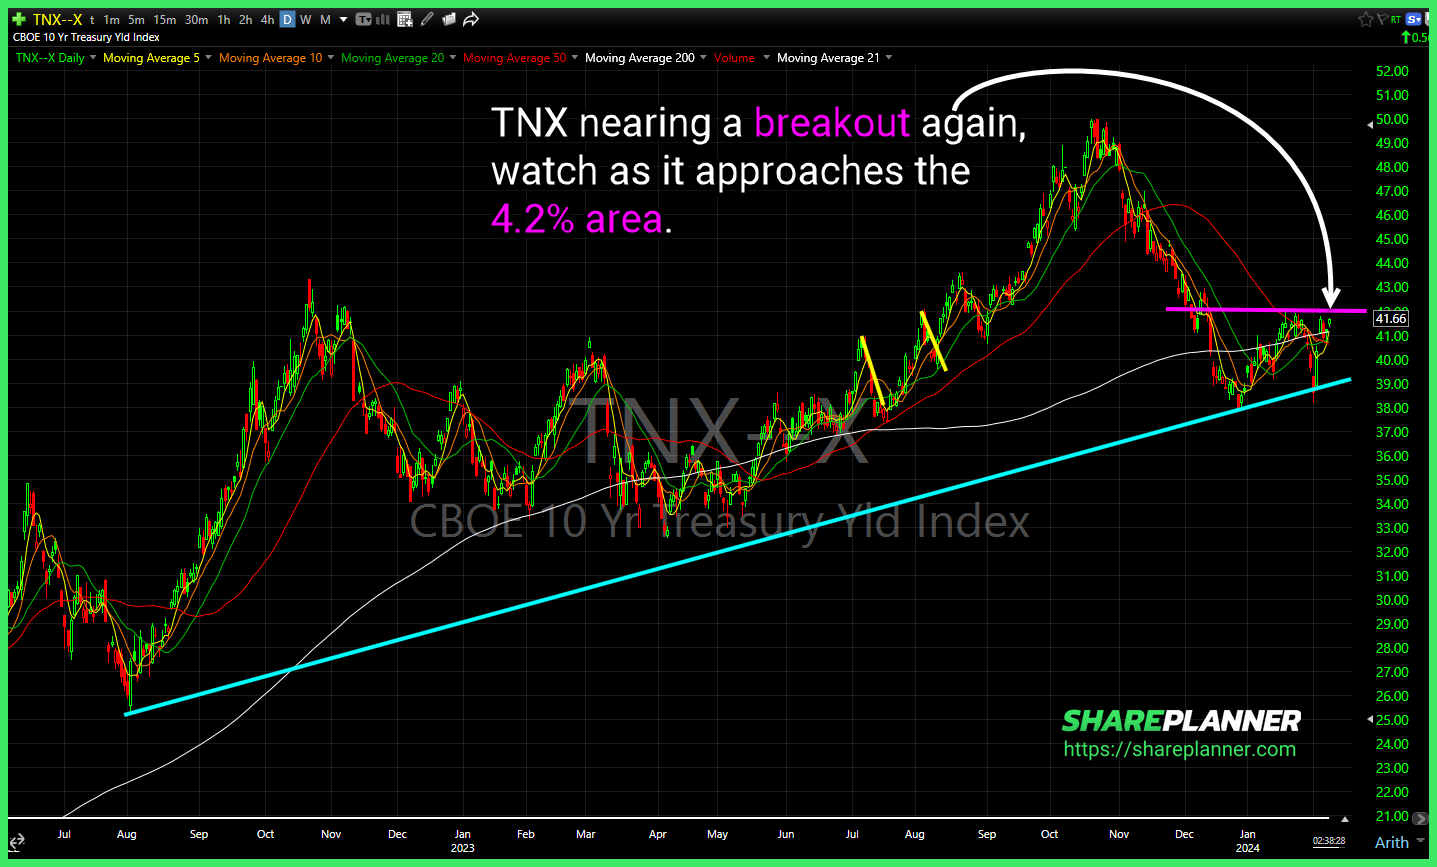
$TNX nearing a breakout again, watch as it approaches the 4.2% area. . $MARA price action will be heavily dependent of Bitcoin price action going forward, but technically, MARA weekly has very little resistance until the low-$30's. $HAL so far holding the rising trend-line, but would prefer it make a higher-high first, before retesting.
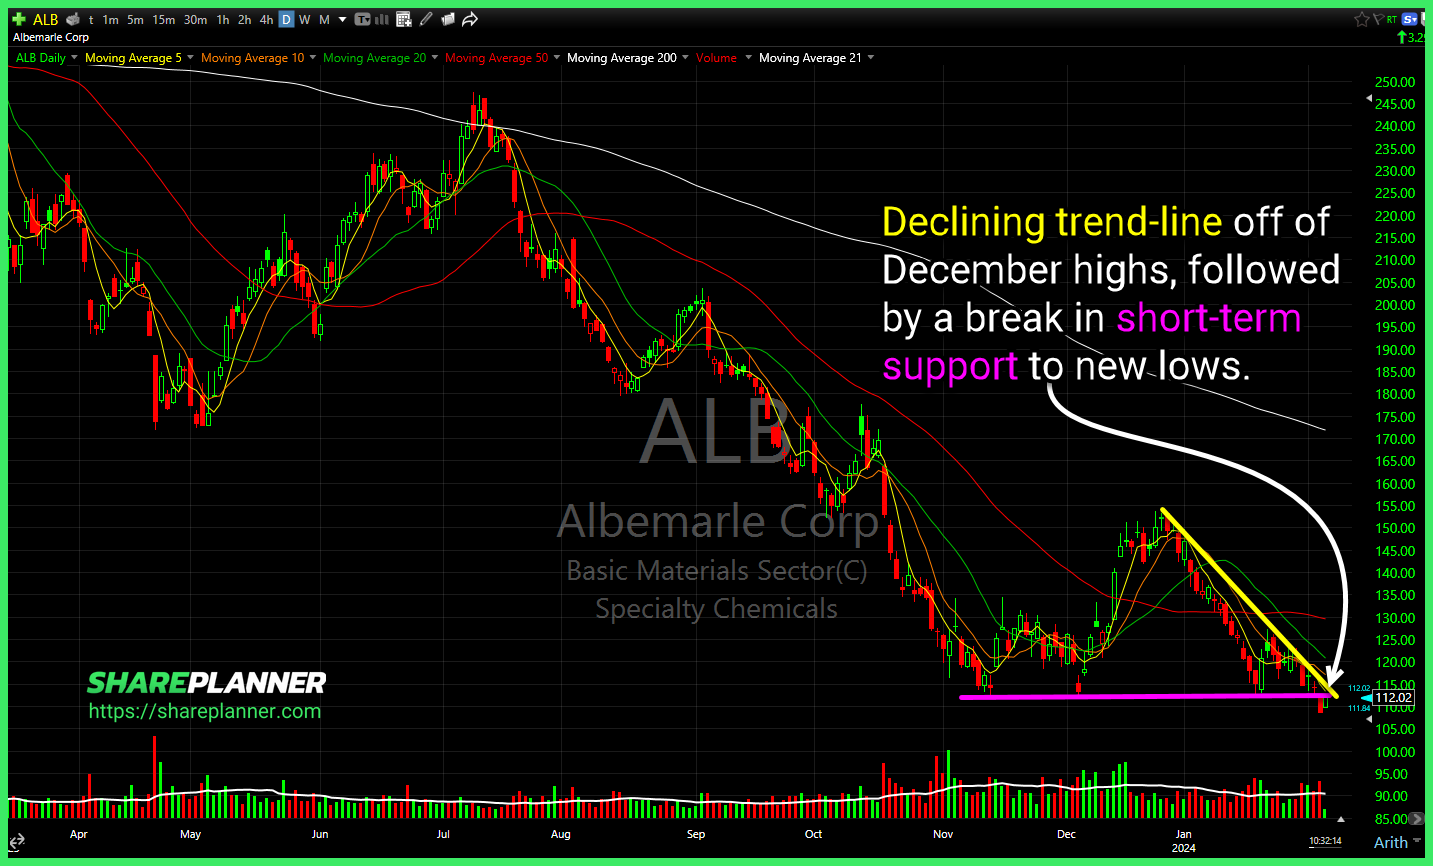
$CEG trading in a perfect channel since inception. Tested the upper band yesterday, but couldn't push through. More risk lower than reward higher here. . $ALB declining trend-line off of December highs, followed by a break in short-term support to new lows. If looking to short this, I think time is on your side to

spc@shareplanner.com
(904) 800-8420
© Copyright 2025 | SharePlanner Inc. All Rights Reserved.
Disclaimer: The information provided on this website is for educational and informational purposes only. Ryan Mallory and/or SharePlanner are not licensed financial advisors, brokers, or tax professionals. The content on this site should not be considered as financial, investment, tax, or legal advice.
All information and opinions expressed herein are based on sources believed to be accurate and reliable. However, we make no representation or warranty as to their accuracy, completeness, or reliability. Any action you take upon the information on this website is strictly at your own risk.
Past performance is not indicative of future results. Investing involves risk, including the possible loss of principal. All investors should make their own decisions based on their specific investment objectives and financial circumstances.
This site may contain links to external websites that are not provided or maintained by or in any way affiliated with Ryan Mallory and/or SharePlanner. Please note that Ryan Mallory and/or SharePlanner do not guarantee the accuracy, relevance, timeliness, or completeness of any information on these external websites.
By using this website, you agree that Ryan Mallory and/or SharePlanner and any affiliated parties are not responsible for any losses or damages resulting from your use of or reliance on the information provided.
It is strongly recommended that you consult with a qualified professional before making any financial decisions.