
The stock market ripped higher following the FOMC Statement issued by Jerome Powell. The stock market soared, and from a technical analysis standpoint, the outlook looks good for stocks going forward. In this video, I provide my analysis on the SPY, QQQ and IWM ETF, as well as my outlook on the VIX index.
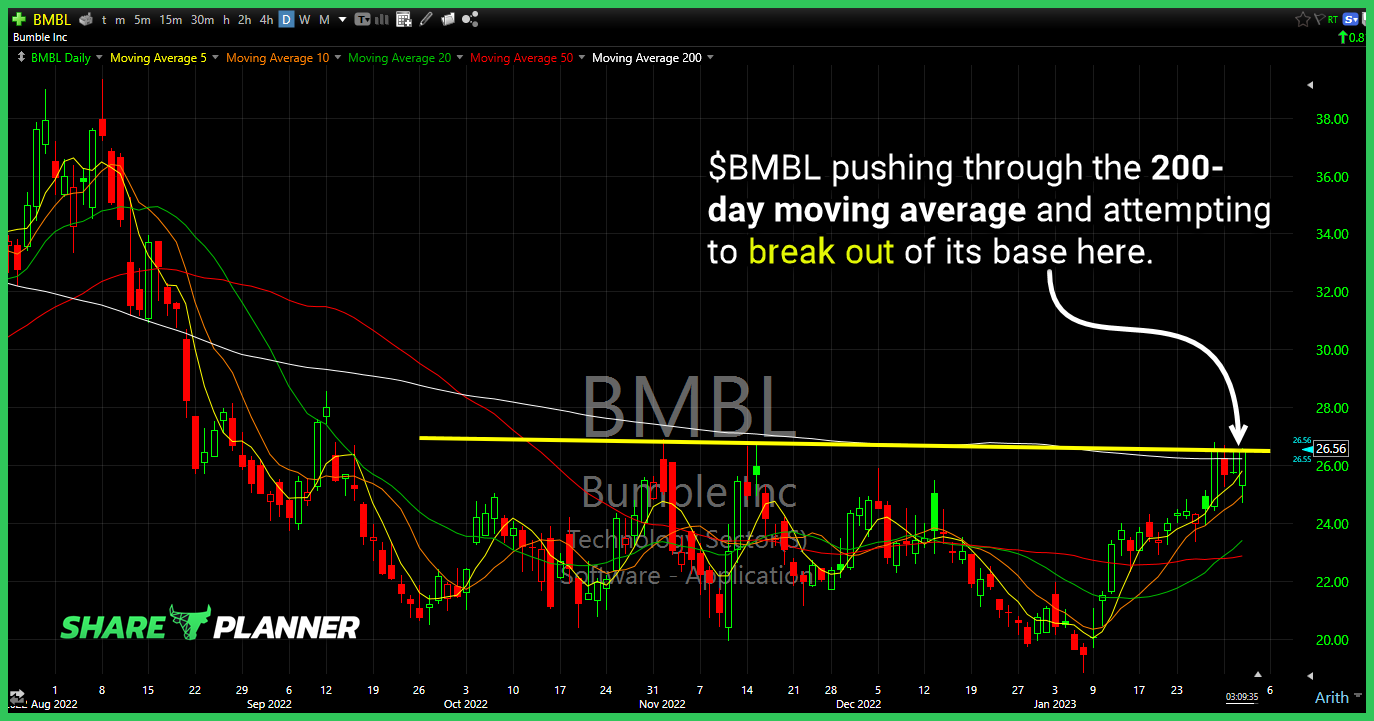
$BMBL pushing through the 200-day moving average and attempting to break out of its base here.
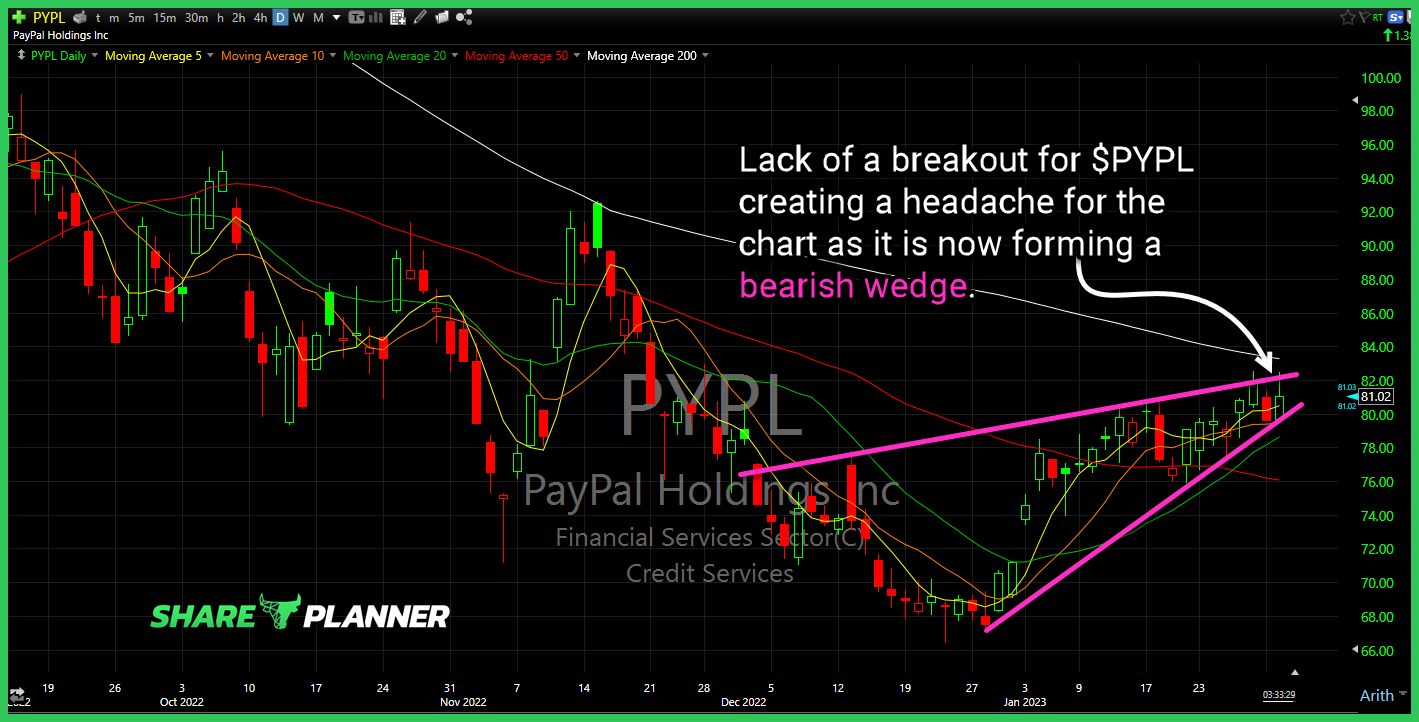
Lack of a breakout for $PYPL creating a headache for the chart as it is now forming a bearish wedge.
The stock market faces a major week of volatility and price swings with the FOMC Statement. This in addition to earnings coming from Meta, Apple, Google and Amazon that will be sure to rock the stock market for better or worse. I'll be going over the selling seen on Monday and whether it is indicative

Episode Overview Trading alone can have its whole set of challenges and ramifications from a mental standpoint and how it affects us in our trading decisions. 🎧 Listen Now: Available on: Apple Podcasts | Spotify | Amazon | YouTube Episode Highlights & Timestamps [0:07] IntroductionRyan kicks off the episode by addressing an email from a listener named Boomer, who is struggling to
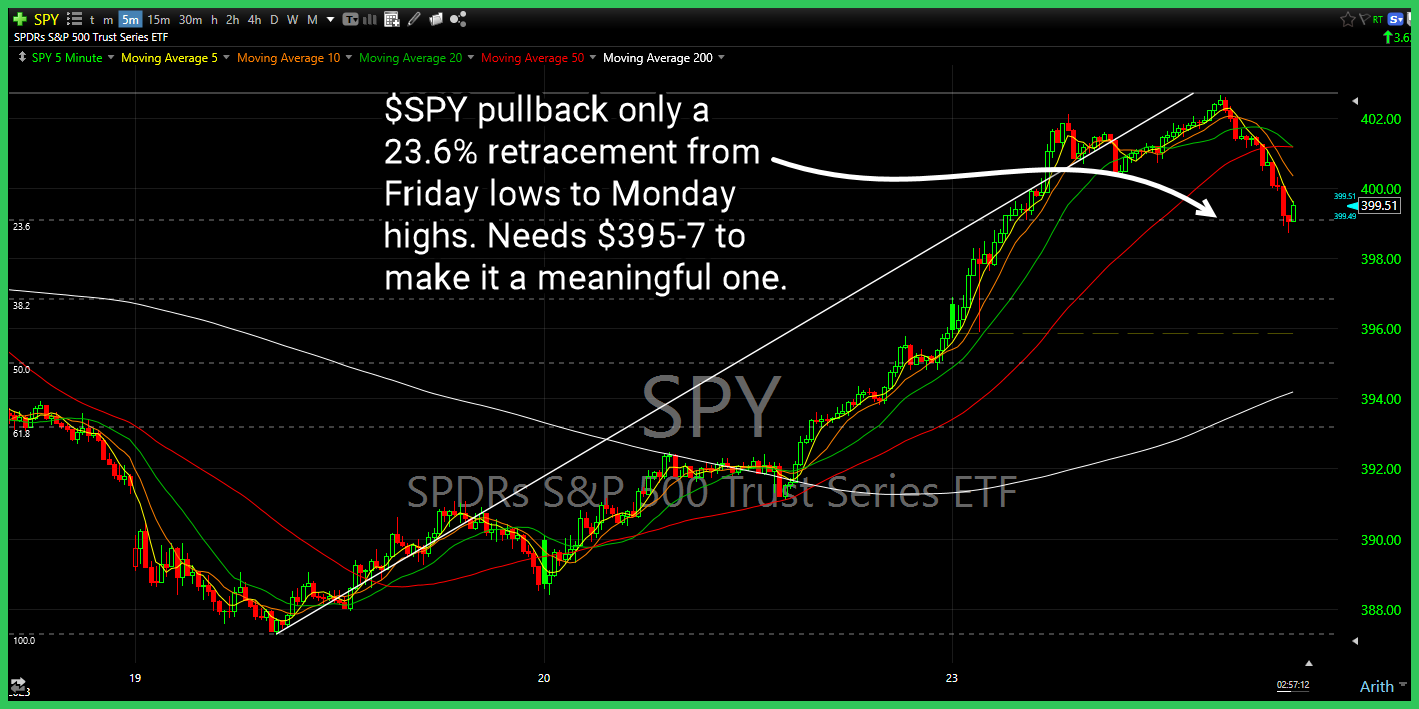
$SPY 5 min intraday pullback only a 23.6% retracement from Thursday lows to Monday highs. Needs $395-7 to make it a meaningful one.

Episode Overview How does one deal with the frustrations that are typically unrelenting as a trader? Ryan details some of his own frustrations that he has experienced so far this year in 2023 as a trader, and what he is doing to overcome them. 🎧 Listen Now: Available on: Apple Podcasts | Spotify | Amazon | YouTube Episode Highlights & Timestamps [0:07]
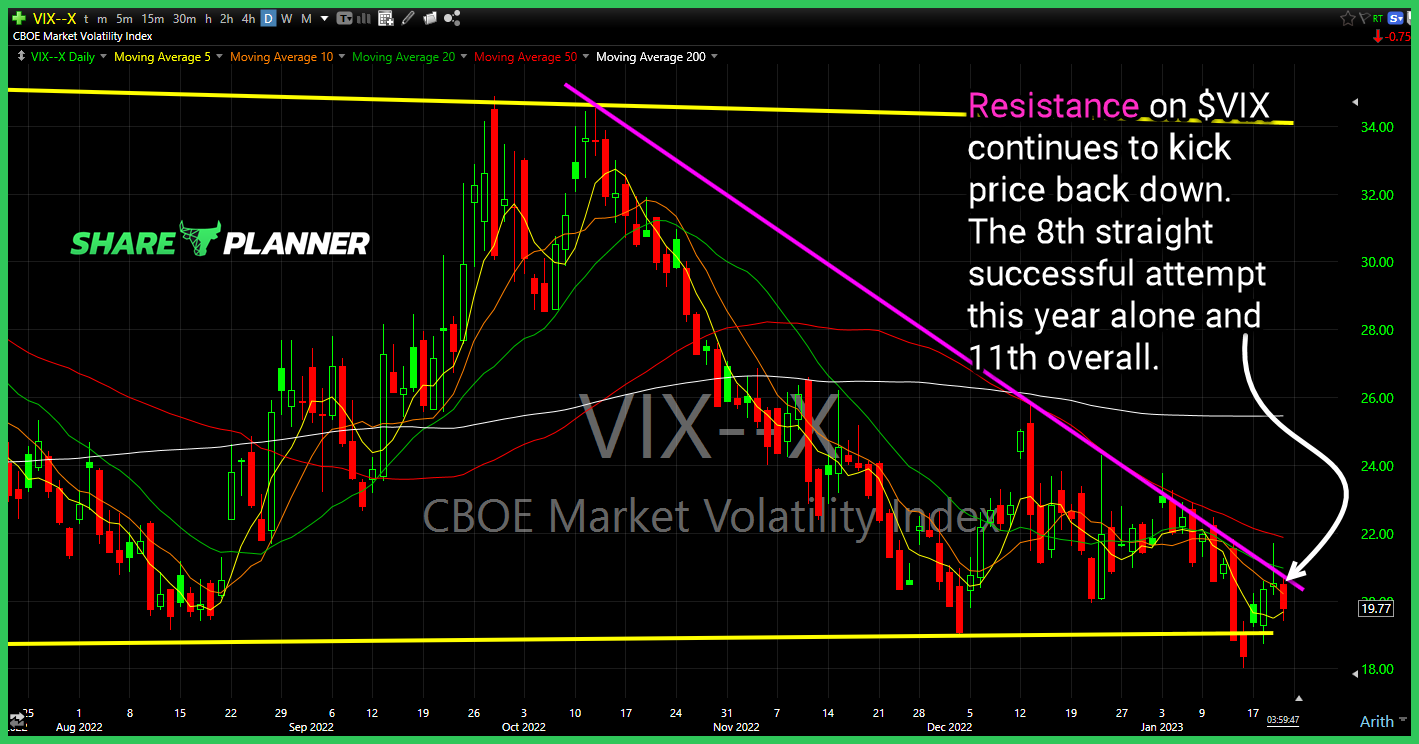
Resistance on $VIX continues to kick price back down. The 8th straight successful attempt this year alone and 11th overall.
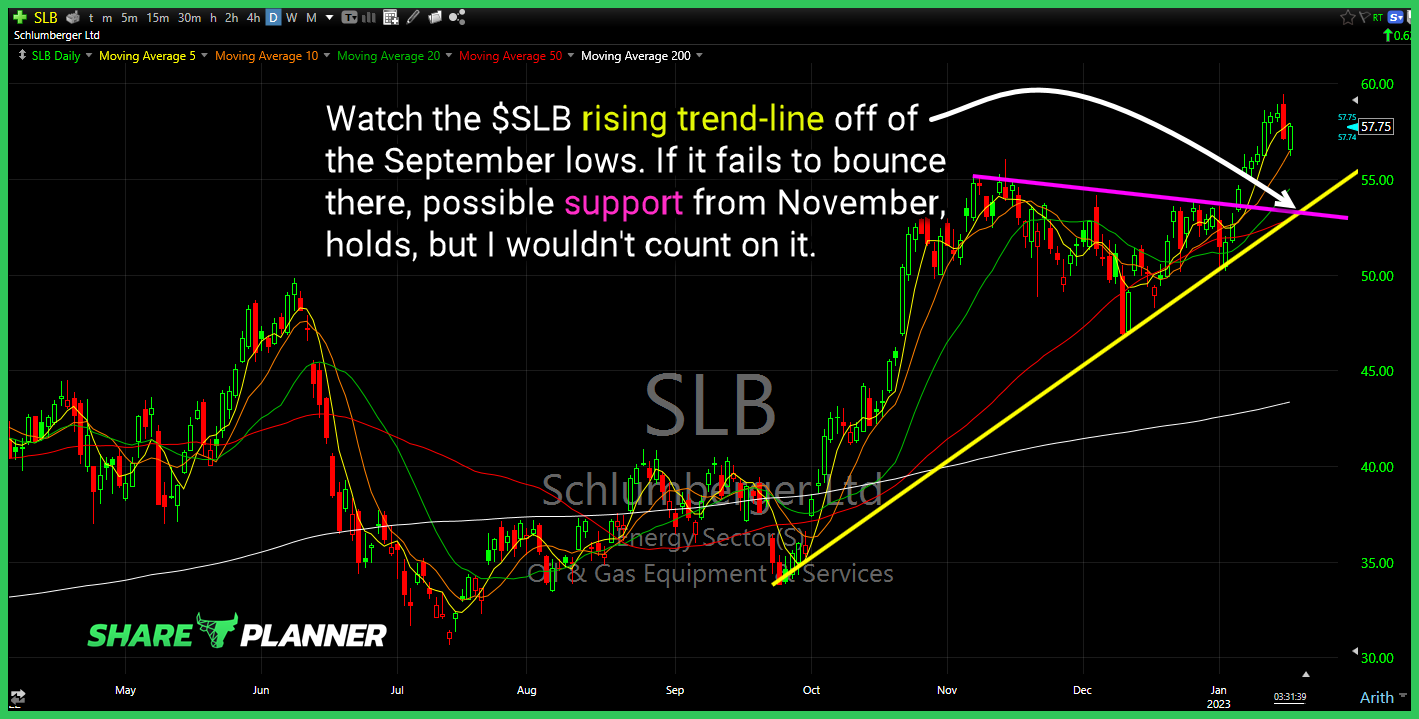
Watch the $SLB rising trend-line off of the September lows. If it fails to bounce there, possible support from November, holds, but I wouldn’t count on it.

spc@shareplanner.com
(904) 800-8420
© Copyright 2025 | SharePlanner Inc. All Rights Reserved.
Disclaimer: The information provided on this website is for educational and informational purposes only. Ryan Mallory and/or SharePlanner are not licensed financial advisors, brokers, or tax professionals. The content on this site should not be considered as financial, investment, tax, or legal advice.
All information and opinions expressed herein are based on sources believed to be accurate and reliable. However, we make no representation or warranty as to their accuracy, completeness, or reliability. Any action you take upon the information on this website is strictly at your own risk.
Past performance is not indicative of future results. Investing involves risk, including the possible loss of principal. All investors should make their own decisions based on their specific investment objectives and financial circumstances.
This site may contain links to external websites that are not provided or maintained by or in any way affiliated with Ryan Mallory and/or SharePlanner. Please note that Ryan Mallory and/or SharePlanner do not guarantee the accuracy, relevance, timeliness, or completeness of any information on these external websites.
By using this website, you agree that Ryan Mallory and/or SharePlanner and any affiliated parties are not responsible for any losses or damages resulting from your use of or reliance on the information provided.
It is strongly recommended that you consult with a qualified professional before making any financial decisions.