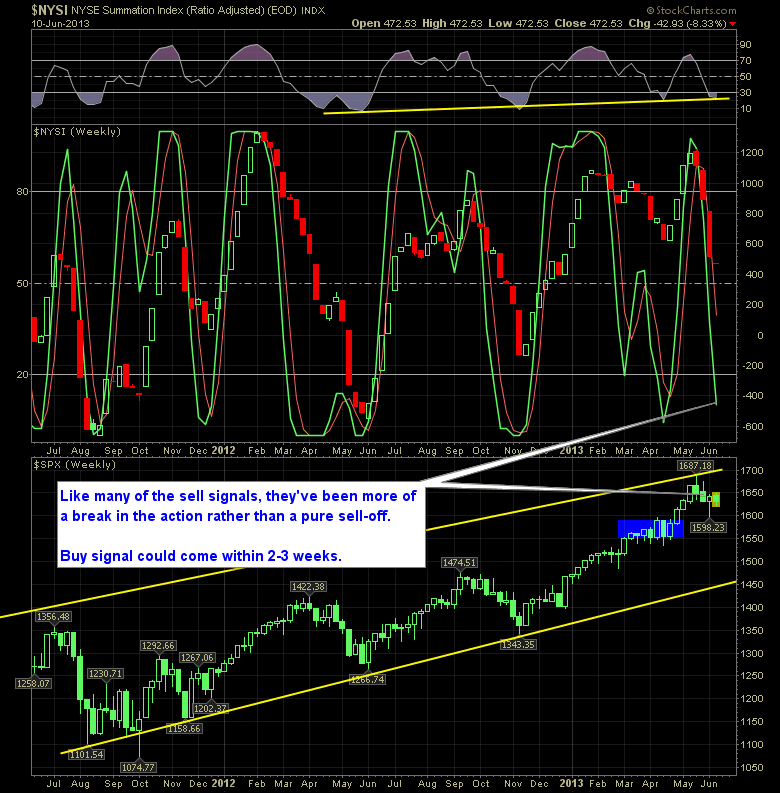
Buy Signal in Reversal Indicator Likely 2-3 Weeks Away The S&P 500 has seen the market move lower now for the third time and four weeks. While this week is still relatively young that may not hold true by week’s end, but nonetheless, we have definitely seen a pause in the aggressive buying that we
Best chart yet for putting the entire housing picture in perspective… Quick Glance at the Market Heat Map and Industries Notables: Overall a mixed bag of good. Materials were weak as were industrials and utilities. Banks held in there, though Tech had more weakness than I would’ve liked to of seen. Be sure to check
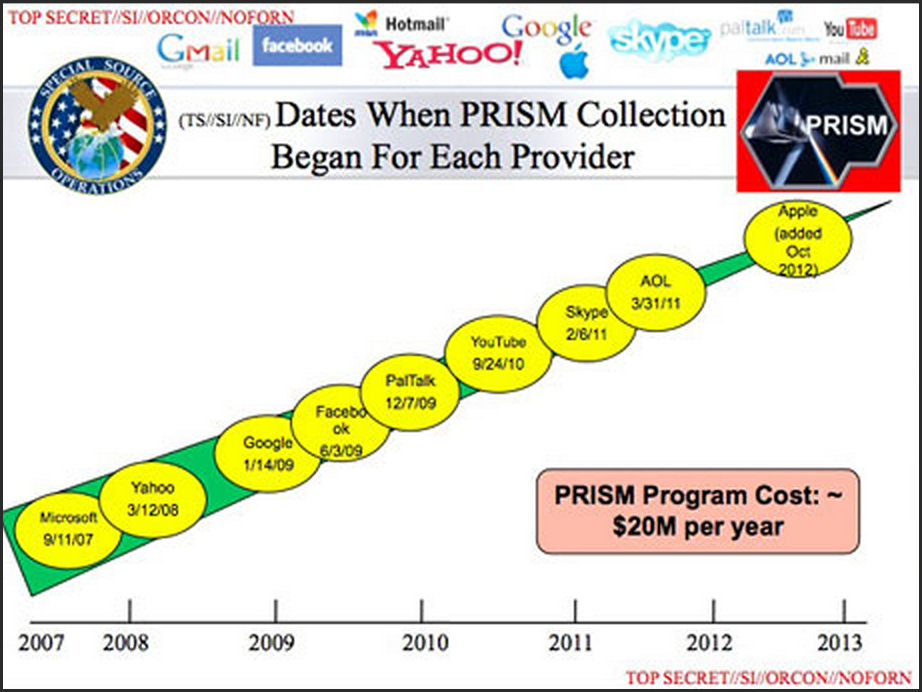
Yup – all these companies are allowing the government to snoop on you… I guess it is appropriate we find out about this on the 64th anniversary of the prophetic book, 1984. Quick Glance at the Market Heat Map and Industries Notables: What… what? Yes, that was a bounce today . Financials bounce back strong
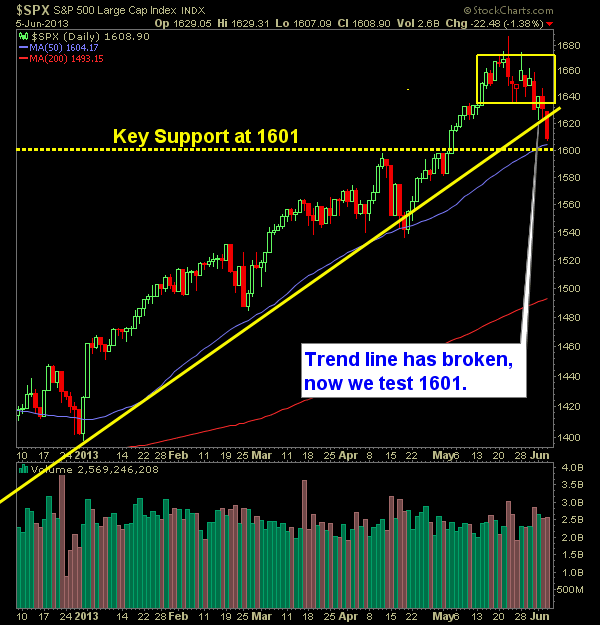
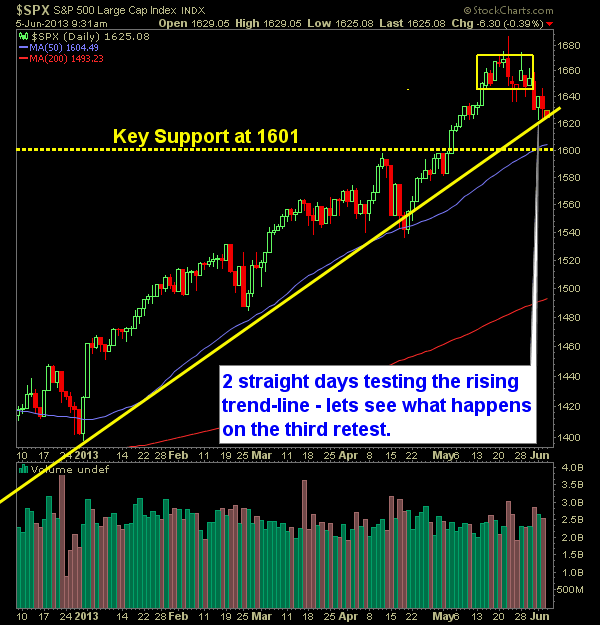
Pre-market update (updated 9am eastern): European markets are trading 0.4% higher. Asian markets traded -1.1% lower. US futures are moderately lower ahead of the bell. Economic reports due out (all times are eastern): Challenger Job-Cut Report (7:30am), Jobless Claims (8:30am), Quarterly Services Survey (10am), EIA Natural Gas Report (10:30am), Treasury STRIPS (3pm) Technical Outlook (SPX):

Chart of the day… All sorts of long standing streaks are coming to an end these days in the financial markets… I’m going to have to find something else to write about soon 🙂 Quick Glance at the Market Heat Map and Industries Notables: That is what you call a market sunburn Financials continues to
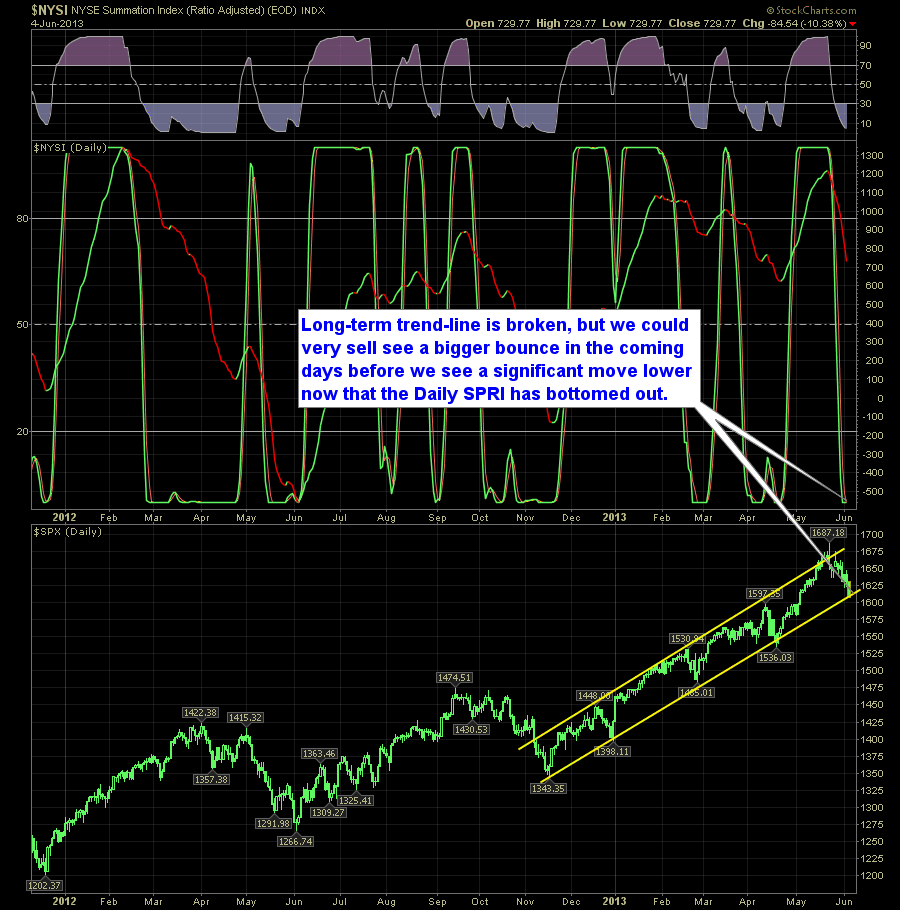
We’ve dropped seven out of the last 10 days in the market, and with that said, we are starting to hist some significant oversold levels in the short-term. The daily SharePlanner Reversal Indicator is showing signs of bottoming out as well as we are seeing our first +4% pullback of 2013 and first since October
Pre-market update (updated 9am eastern): European markets are trading -1.2% lower. Asian markets traded -2.1% lower. US futures are moderately lower ahead of the bell. Economic reports due out (all times are eastern): MBA Purchase Applications (7am), ADP Employment Report (8:15am), Productivity and Costs (8:30am), Factory Orders (10am), ISM Non Manufacturing Index (10am), EIA Petroleum Status
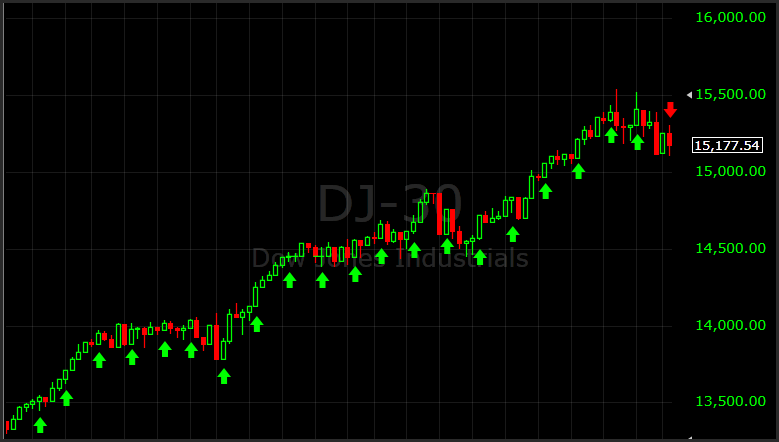
Chart of the day… All good things come to an end. Twenty straight Tuesdays of the Dow finishing higher came to an end today. Quick Glance at the Market Heat Map and Industries Notables: Financials that were tepid yesterday when the market was up, led the way to the downside today. Materials reversed yesterday’s gains
Chart of the day… Not surprised by the stats, but very interesting to see it compared between two generations. Quick Glance at the Market Heat Map and Industries Notables: Materials were very respectable in today’s action Health care had some major winners today Financials and most of technology sat out today’s rally. Be sure to
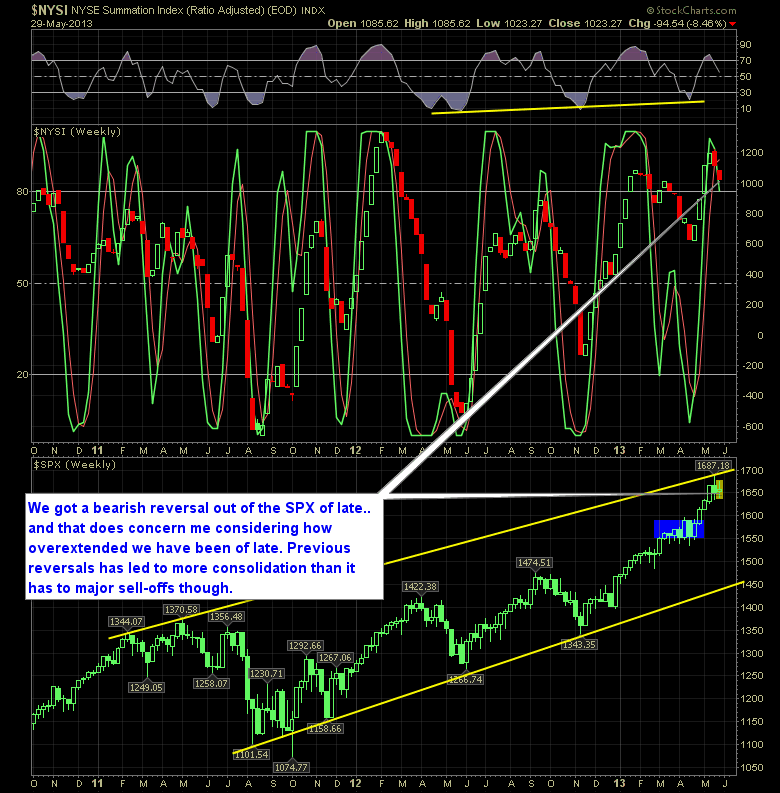
This kind of indicator reading makes me nervous. It is in major conflict with what we are seeing out of this market. It keeps pushing higher and higher, no matter how horrible GDP, Employment and every other report out there says it is. Of course with the Fed spoon feeding this market over the last

spc@shareplanner.com
(904) 800-8420
© Copyright 2025 | SharePlanner Inc. All Rights Reserved.
Disclaimer: The information provided on this website is for educational and informational purposes only. Ryan Mallory and/or SharePlanner are not licensed financial advisors, brokers, or tax professionals. The content on this site should not be considered as financial, investment, tax, or legal advice.
All information and opinions expressed herein are based on sources believed to be accurate and reliable. However, we make no representation or warranty as to their accuracy, completeness, or reliability. Any action you take upon the information on this website is strictly at your own risk.
Past performance is not indicative of future results. Investing involves risk, including the possible loss of principal. All investors should make their own decisions based on their specific investment objectives and financial circumstances.
This site may contain links to external websites that are not provided or maintained by or in any way affiliated with Ryan Mallory and/or SharePlanner. Please note that Ryan Mallory and/or SharePlanner do not guarantee the accuracy, relevance, timeliness, or completeness of any information on these external websites.
By using this website, you agree that Ryan Mallory and/or SharePlanner and any affiliated parties are not responsible for any losses or damages resulting from your use of or reliance on the information provided.
It is strongly recommended that you consult with a qualified professional before making any financial decisions.