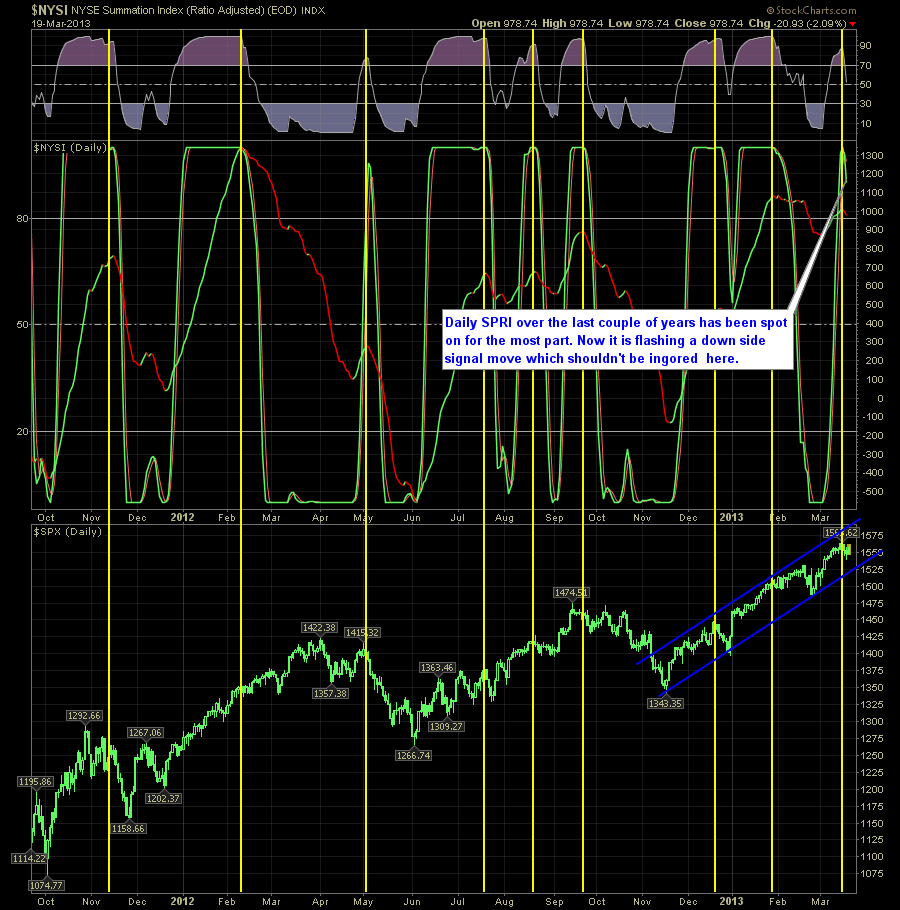
Daily Reversal Indicator has been spot-on over the last couple of years I don't typically publish the daily look into the SPRI. Traditionally it has been from the view of the weekly chart. But these two different time frames can often times produce a completely different look. Right now the daily SPRI is indicating that
The ineffectiveness of the drug war & tax dollar waste Quick Glance at the Market Heat Map and Industries Notables: Basic Materials across the board were the markets worst performers. Consumer Goods and Healthcare had a surprising amount of strength in it today. Banks still showing a lot of pain while Tech managed
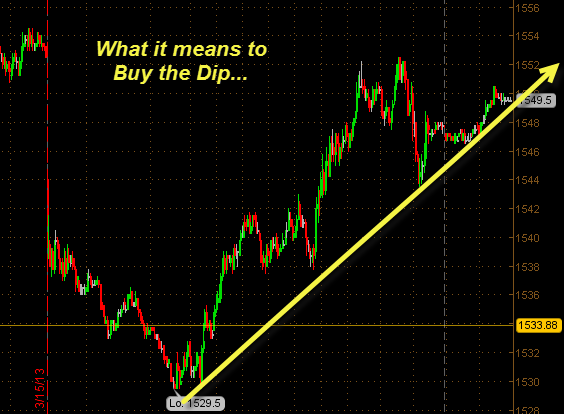
This is what the mean by “Just Buy the Dip” A nice 5-minute chart of the /ES contract from last night until today’s close. Quick Glance at the Market Heat Map and Industries Notables: You can almost bank on Apple (AAPL) being up any day that the market is down. How much worse


Reversal Indicator Might Be Signaling a New Bull Market While in the short-term the market could benefit from a few points of a move lower (jestly speaking), there's no doubt that the market is moving into territory that is completely new terrain. While we understand that it isn't so much because of a new golden

Pre-market update (updated 8am eastern): European markets are brading 0.4% higher. Asian markets traded flat. US futures are trading slightly higher ahead of the opening bell. Economic reports due out (all times are eastern): Challenger Job-Cut Report (7:30am), International Trade (8:30am), Jobless Claims (8:30am), Quarterly Services (10am), EIA Natural Gas Report (10:30am), Consumer Credit (3pm) Technical
-
Pre-market update (updated 8am eastern): European markets are brading 0.4% higher. Asian markets traded flat. US futures are trading slightly higher ahead of the opening bell. Economic reports due out (all times are eastern): Challenger Job-Cut Report (7:30am), International Trade (8:30am), Jobless Claims (8:30am), Quarterly Services (10am), EIA Natural Gas Report (10:30am), Consumer Credit (3pm) Technical


Never a Dip That Doesn’t Get Bought Up! This market continues to be a bear trap at every juncture where there’s a sell-off of any kind. The VIX is in the 13’s – and for good measure; fearing the downside to this ever-rising market is a fool’s game to most. But for those who

Historic day for the Dow Quick Glance at the Market Heat Map and Industries Notables: Apple (AAPL) finally aligned itself with the market on an up-day. Technology nearly flawless. Banks weren’t all there, and didn’t show as much enthusiasm. Be sure to check out my latest swing trades and overall past performance

spc@shareplanner.com
(904) 800-8420
© Copyright 2025 | SharePlanner Inc. All Rights Reserved.
Disclaimer: The information provided on this website is for educational and informational purposes only. Ryan Mallory and/or SharePlanner are not licensed financial advisors, brokers, or tax professionals. The content on this site should not be considered as financial, investment, tax, or legal advice.
All information and opinions expressed herein are based on sources believed to be accurate and reliable. However, we make no representation or warranty as to their accuracy, completeness, or reliability. Any action you take upon the information on this website is strictly at your own risk.
Past performance is not indicative of future results. Investing involves risk, including the possible loss of principal. All investors should make their own decisions based on their specific investment objectives and financial circumstances.
This site may contain links to external websites that are not provided or maintained by or in any way affiliated with Ryan Mallory and/or SharePlanner. Please note that Ryan Mallory and/or SharePlanner do not guarantee the accuracy, relevance, timeliness, or completeness of any information on these external websites.
By using this website, you agree that Ryan Mallory and/or SharePlanner and any affiliated parties are not responsible for any losses or damages resulting from your use of or reliance on the information provided.
It is strongly recommended that you consult with a qualified professional before making any financial decisions.