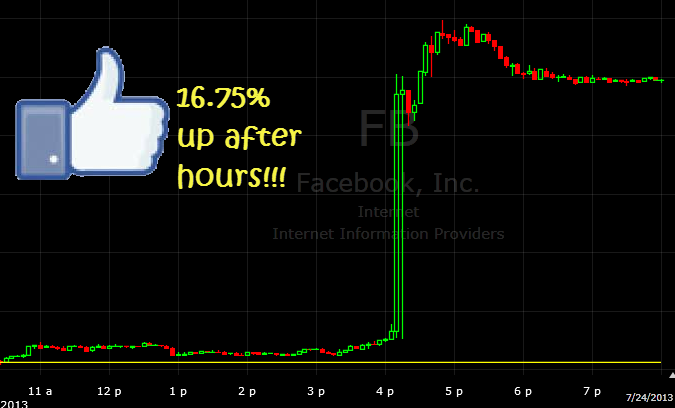
Sometimes good things happen to Facebook Stock Quick Glance at the Market Heat Map and Industries Notables: Utilities and Materials were royal failures today. Tech shows relative strenght…surprisingly. Banks had no footing either. . Be sure to check out my latest swing trades and overall past performance

The best indicator on the web, or so I like to call it. But it’s also the only indicator that I care to concern myself with. I personally hate indicators and oscillators – but not this one…. The Daily SharePlanner Reversal Indicator shows that a pullback is a strong possibility any day now and quite
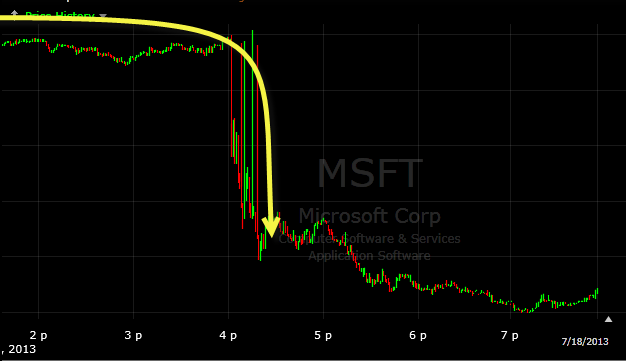
Microsoft (MSFT) and Google (GOOG) get HAMMERED after hours. Quick Glance at the Market Heat Map and Industries Notables: Oh my gosh! Banks were freakin’ phenomenal – where have you been all my life!?! It was like tech knew ahead a time after hours were going to be a disaster. Healthcare wasn’t too far behind
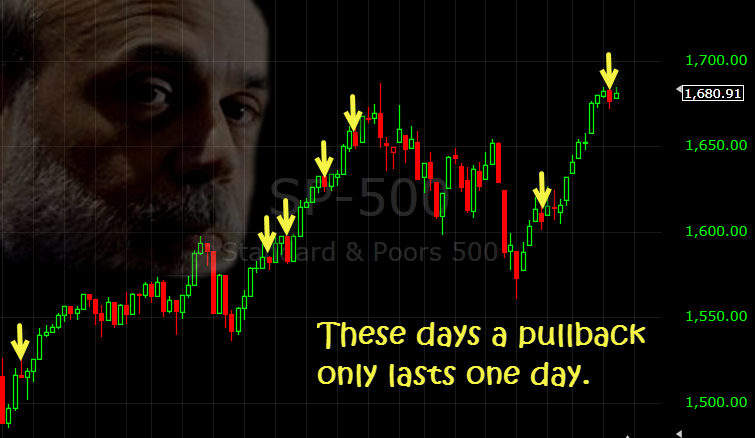
A One Day Pullback…If You’re Lucky Quick Glance at the Market Heat Map and Industries Notables: Yesterday’s weak banks were today’s leaders. Materials made a mild recovery. Technology was weighed down by Microsoft (MSFT) weakness and big tech non-participation. Be sure to check out my latest swing trades and overall past performance
I think all of us fit in one of these categories… Quick Glance at the Market Heat Map and Industries Notables: Tech did not want to give up the fight – needs more weakness. Materials, utilities, goods were hit hardest. Services did better after yesterday’s obvious weakness. Big banks fought hard to remain up. Be
I think all of us fit in one of these categories… Quick Glance at the Market Heat Map and Industries Notables: Tech did not want to give up the fight – needs more weakness. Materials, utilities, goods were hit hardest. Services did better after yesterday’s obvious weakness. Big banks fought hard to remain up. Be
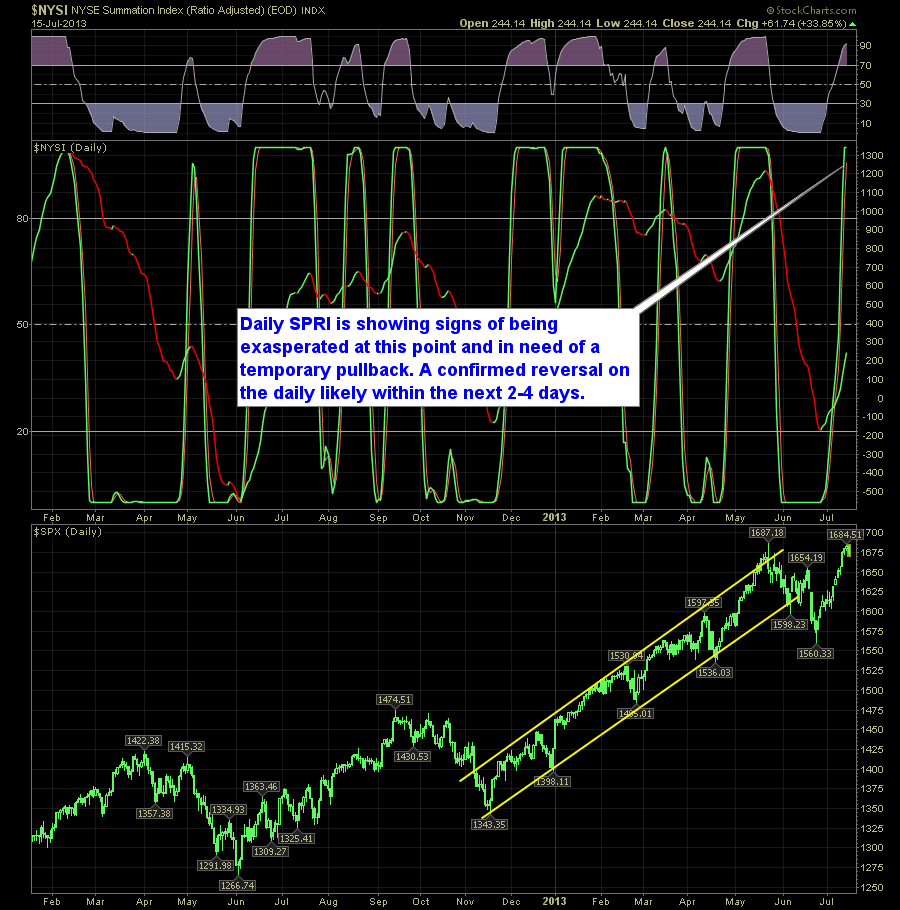
Reversal Indicator shows a temporary pullback on the daily, but a healthy weekly chart. It might appear on the surface that the Daily and Weekly SharePlanner Reversal Indicators are showing two different pictures of this market…but they aren’t. Here the daily is indicating a condition ripe for a pullback or reversal. But then when you
-
Reversal Indicator shows a temporary pullback on the daily, but a healthy weekly chart. It might appear on the surface that the Daily and Weekly SharePlanner Reversal Indicators are showing two different pictures of this market…but they aren’t. Here the daily is indicating a condition ripe for a pullback or reversal. But then when you
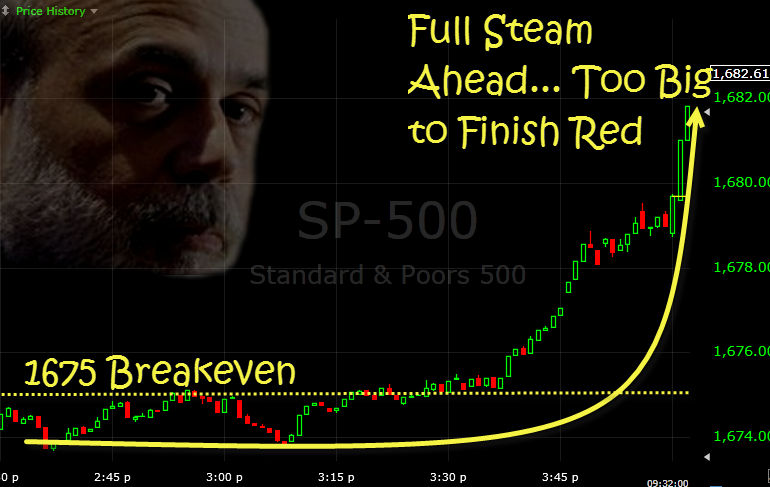
The Fed Goes Green… Quick Glance at the Market Heat Map and Industries Notables: Utilities continue to rock. Big Banks did good, small banks did bad. Services were miserable as was technology. Be sure to check out my latest swing trades and overall past performance

spc@shareplanner.com
(904) 800-8420
© Copyright 2025 | SharePlanner Inc. All Rights Reserved.
Disclaimer: The information provided on this website is for educational and informational purposes only. Ryan Mallory and/or SharePlanner are not licensed financial advisors, brokers, or tax professionals. The content on this site should not be considered as financial, investment, tax, or legal advice.
All information and opinions expressed herein are based on sources believed to be accurate and reliable. However, we make no representation or warranty as to their accuracy, completeness, or reliability. Any action you take upon the information on this website is strictly at your own risk.
Past performance is not indicative of future results. Investing involves risk, including the possible loss of principal. All investors should make their own decisions based on their specific investment objectives and financial circumstances.
This site may contain links to external websites that are not provided or maintained by or in any way affiliated with Ryan Mallory and/or SharePlanner. Please note that Ryan Mallory and/or SharePlanner do not guarantee the accuracy, relevance, timeliness, or completeness of any information on these external websites.
By using this website, you agree that Ryan Mallory and/or SharePlanner and any affiliated parties are not responsible for any losses or damages resulting from your use of or reliance on the information provided.
It is strongly recommended that you consult with a qualified professional before making any financial decisions.