
Chart of the day… Quick Glance at the Market Heat Map and Industries Notables: Financials hung in there. Healthcare remained steady. Utilities continue to falter, and tech not far behind. Be sure to check out my latest swing trades and overall past performance
Understanding Overbought Conditions in Today’s Market What tends to happen of late is that instead of seeing a pullback on the daily chart to alleviate the market of overbought conditions, what tends to be the case is that the market will sell-off intraday and simply buy the dip later on, some times as early as
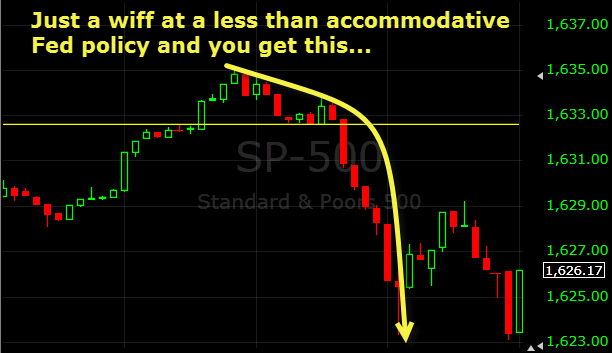
Chart of the day… Quick Glance at the Market Heat Map and Industries Notables: Breathtaking weakness in financials. Utilities might have been even worse. Tech’s big names dragged the sector down. Be sure to check out my latest swing trades and overall past performance

Daily Reversal Indicator tells me that a pullback is needed Price action is overextended big time. I am still bullish on this market, but I have to side with the daily SPRI here that states we need to pullback some in the very short-term. Ideally a few days of weakness, controlled weakness, is what I
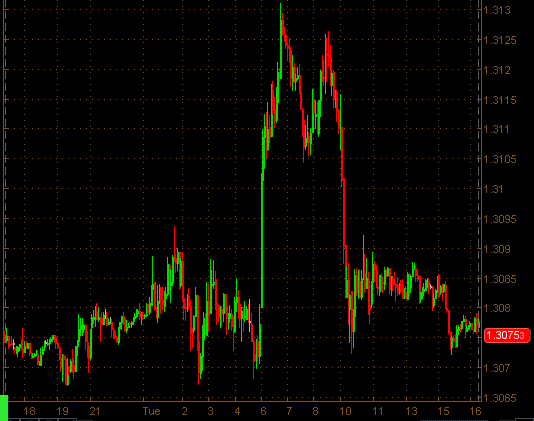
One of the most extreme intraday double tops you’ll ever see (this comes from the EUR/USD)… Quick Glance at the Market Heat Map and Industries Notables: Technology shows a lot of heavy weakness. Banks cooled down a little bit. Consumer Goods and Utilities boucned back nicely. Be sure to check out my latest

Oscar’s most excellent day-trade… Quick Glance at the Market Heat Map and Industries Notables: Utilities and Healthcare were a royal mess today, and lagged the market significantly. Services and goods were also hit hard. Financials definitely paced the market higher today. Be sure to check out my latest swing trades and overall past

Reversal Shows a Bullish Storm Emerging It isn’t often when you get the SharePlanner Reversal Indicator line up perfectly, and I do mean perfectly with price action and that is what we are getting with today’s latest reading on the Weekly SPRI. Price is breaking out on the weekly chart right at the same time
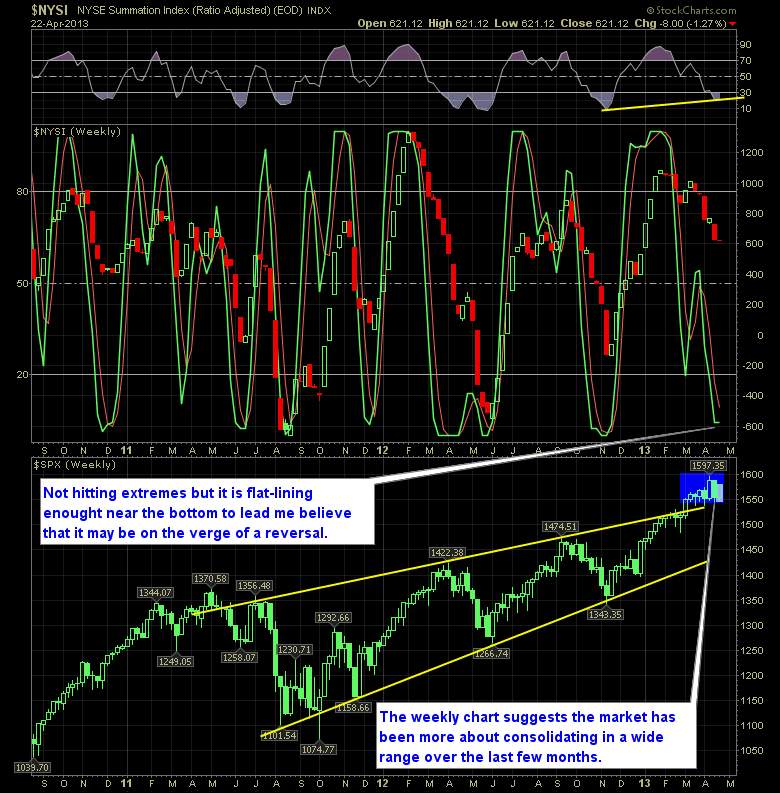
Reversal Indicator shows selling may be exhausted Traders are once again starting to ignore the larger threats to the global markets and looking instead at how they can get back on the fed gravy-train of this perpetual bull market that we are in. The notion of going short on an extended swing-trade basis does not
No clear signal yet in terms of what direction this market wants to go in. I thought with the overnight bullishness that we were seeing that the market was setting itself up for another big run. But by the time the market had rolled around, that strength had quickly evaporated. I’m looking to add one

Reversal Indicator shows possible extent of sell-off. I’m not sure how long this market sell-off lasts. Frankly, we haven’t see a dead-cat bounce yet this year, but today is starting to look like one as a result of today’s move lower. We are testing the lower channel of rising support. That is good for

spc@shareplanner.com
(904) 800-8420
© Copyright 2025 | SharePlanner Inc. All Rights Reserved.
Disclaimer: The information provided on this website is for educational and informational purposes only. Ryan Mallory and/or SharePlanner are not licensed financial advisors, brokers, or tax professionals. The content on this site should not be considered as financial, investment, tax, or legal advice.
All information and opinions expressed herein are based on sources believed to be accurate and reliable. However, we make no representation or warranty as to their accuracy, completeness, or reliability. Any action you take upon the information on this website is strictly at your own risk.
Past performance is not indicative of future results. Investing involves risk, including the possible loss of principal. All investors should make their own decisions based on their specific investment objectives and financial circumstances.
This site may contain links to external websites that are not provided or maintained by or in any way affiliated with Ryan Mallory and/or SharePlanner. Please note that Ryan Mallory and/or SharePlanner do not guarantee the accuracy, relevance, timeliness, or completeness of any information on these external websites.
By using this website, you agree that Ryan Mallory and/or SharePlanner and any affiliated parties are not responsible for any losses or damages resulting from your use of or reliance on the information provided.
It is strongly recommended that you consult with a qualified professional before making any financial decisions.