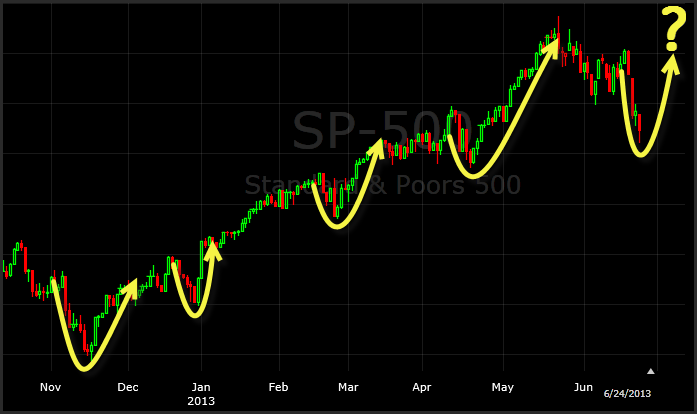

For every market sell-off there is also a market squeeze that follows. It always happens, bears get greedy to the downside just like the bulls do the the upside. But when the market starts rallying, the experience of the last four years leaves then no opportunity to second guess, but to just cover their
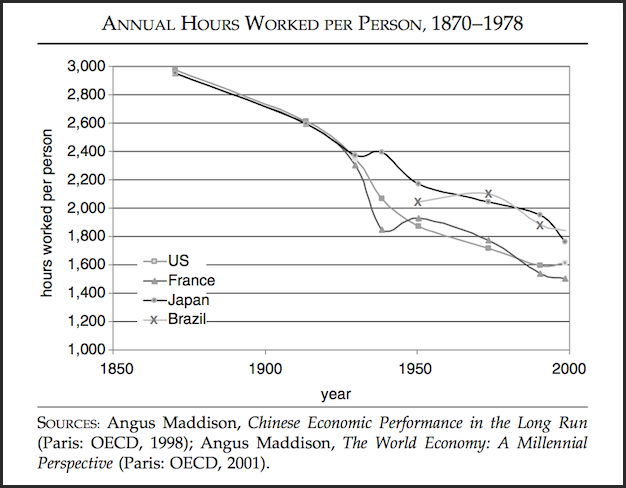
Chart of the Day… Considering the fact that 2,080 hours represents a full-time job, it should be considered that the world is done with the full-time work. …I think I should be considered a major outlier. Quick Glance at the Market Heat Map and Industries Notables: Utilities are on the rebound – not necessary the
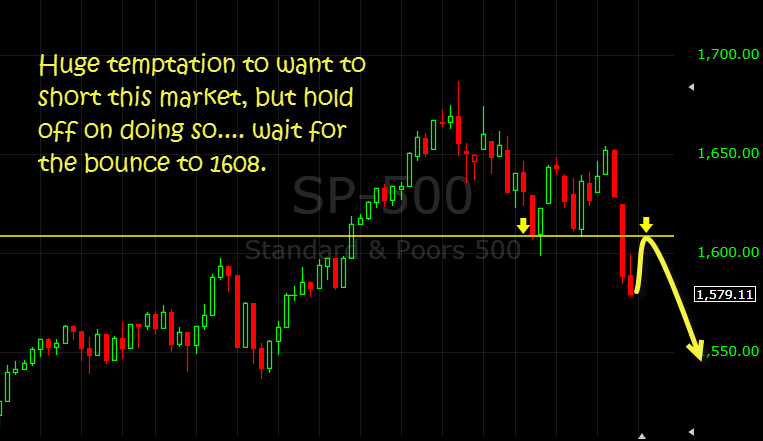
I thought we would’ve bounced hard right out of the gates today, because for all of 2013 that has been essentially what we have seen, but this sell-off is much different from the ones we’ve seen throughout this year. This one has character to it. The bulls tried to bounce the market higher in the

Chart of the Day… Quick Glance at the Market Heat Map and Industries Notables: No man should be allowed to have this much power over our financial markets. Not one single sector or industry was spared. Thank you Ben, for being such a cancer to our financial system. Be sure to check out my latest

Chart of the Day… Quick Glance at the Market Heat Map and Industries Notables: No single sector that just took the bull by the horns Overall, sectors like the financial and materials were just adequate. Technology showed solid strength as well. Be sure to check out my latest swing trades and overall past performance

SharePlanner Reversal Indicator is looking ultra bullish The trading stars are aligning for this market, and there is plenty of reason to be bullish as the market is pushing through key resistance at 1648 and will coincide well with the Weekly SPRI next week when it posts (barring a massive market reversal). I expect there

Chart of the Day… Quick Glance at the Market Heat Map and Industries Notables: Financials were solid, but Materials were stellar. Technology just can’t move up in unison… always a few stubborn stocks trying to hold everyone back. Consumer Goods were near flawless. Be sure to check out my latest swing trades and overall past
This market seems like at best, a mixed bag of goods. There is no way to know whether it goes up or down from here. My bias still remains long at this juncture, but the reasoning is starting to get clouded. There are plenty of bearish reasons to be skeptical of this market, but in
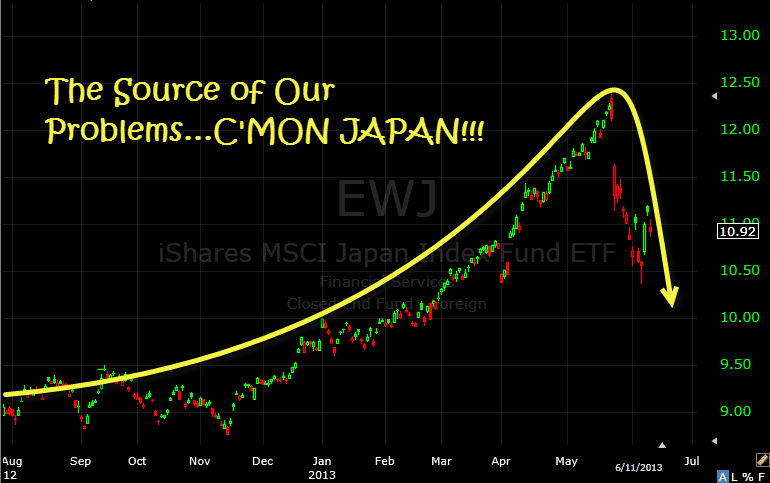
Chart of the Day… Quick Glance at the Market Heat Map and Industries Notables: Financials were an absolute mess Materials in general and oil in particular were desceimated. Everything else was in the slums…nothing more to report here. Be sure to check out my latest swing trades and overall past performance

spc@shareplanner.com
(904) 800-8420
© Copyright 2025 | SharePlanner Inc. All Rights Reserved.
Disclaimer: The information provided on this website is for educational and informational purposes only. Ryan Mallory and/or SharePlanner are not licensed financial advisors, brokers, or tax professionals. The content on this site should not be considered as financial, investment, tax, or legal advice.
All information and opinions expressed herein are based on sources believed to be accurate and reliable. However, we make no representation or warranty as to their accuracy, completeness, or reliability. Any action you take upon the information on this website is strictly at your own risk.
Past performance is not indicative of future results. Investing involves risk, including the possible loss of principal. All investors should make their own decisions based on their specific investment objectives and financial circumstances.
This site may contain links to external websites that are not provided or maintained by or in any way affiliated with Ryan Mallory and/or SharePlanner. Please note that Ryan Mallory and/or SharePlanner do not guarantee the accuracy, relevance, timeliness, or completeness of any information on these external websites.
By using this website, you agree that Ryan Mallory and/or SharePlanner and any affiliated parties are not responsible for any losses or damages resulting from your use of or reliance on the information provided.
It is strongly recommended that you consult with a qualified professional before making any financial decisions.