
We’ve had two straight days with the SPX trading in the red, not counting today yet. We haven’t seen that since 1/31 & 2/3. But really not a big deal at this point. However, the SharePlanner Reversal Indicator on both the daily and weekly charts shows some significant problems for the market in the
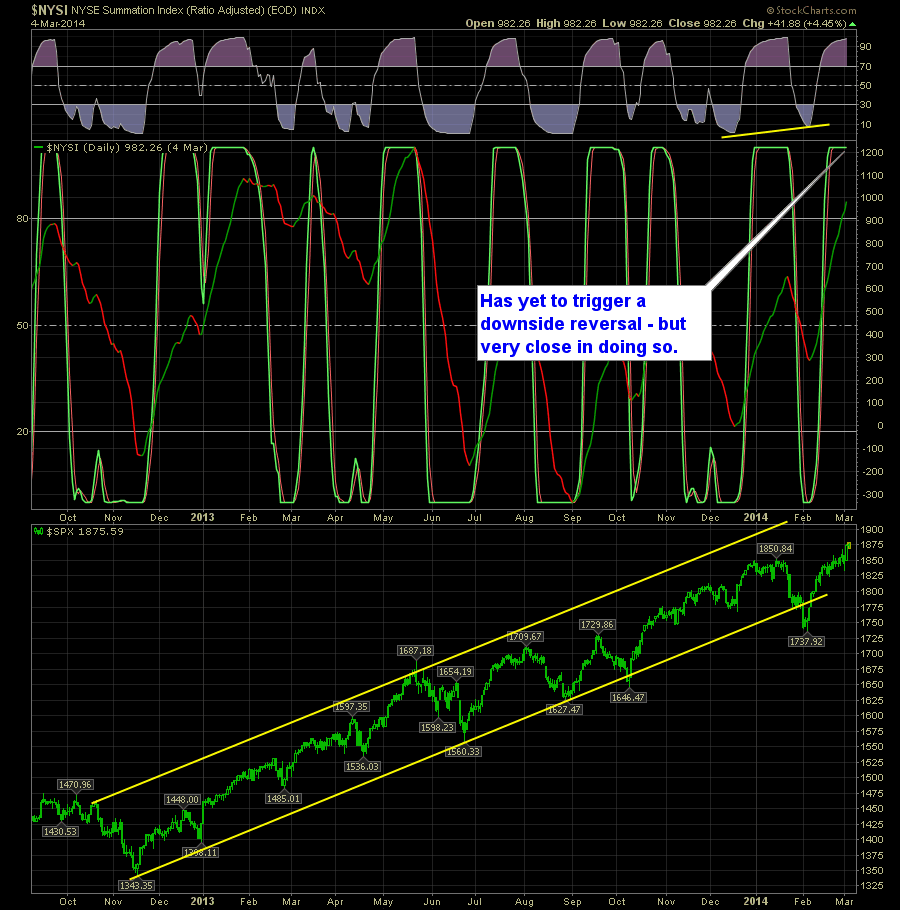
Continuing its theme from last week, the SharePlanner Reversal Indicator is continuing to red-flag traders about a possible reversal that could be coming the market’s ways. Both the Daily and the Weekly are sitting at extreme levels. On the daily in particular – you have the situation where the slightest bit of weakness in the
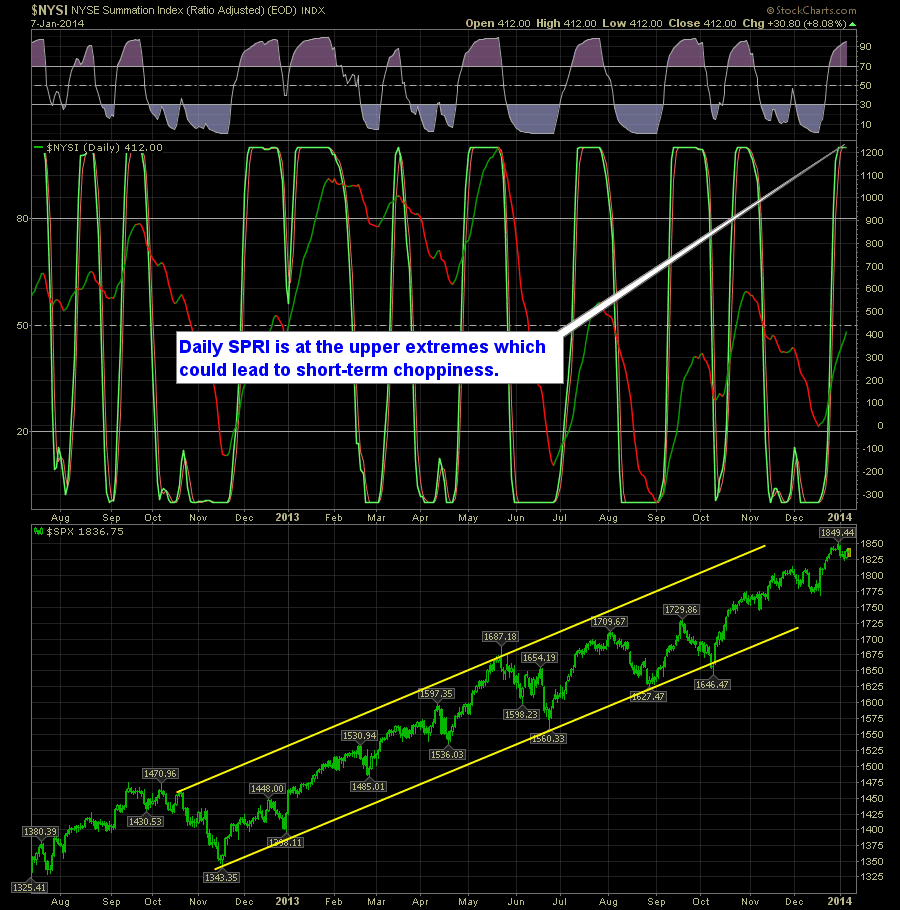
We haven’t seen a lot of the same messaging out of the SharePlanner Reversal Indicator time frames in the past couple of months. But that has all changed now. On the daily SPRI you have it where the indicator is ready for a full fledged reversal and that could mean that profit taking here and
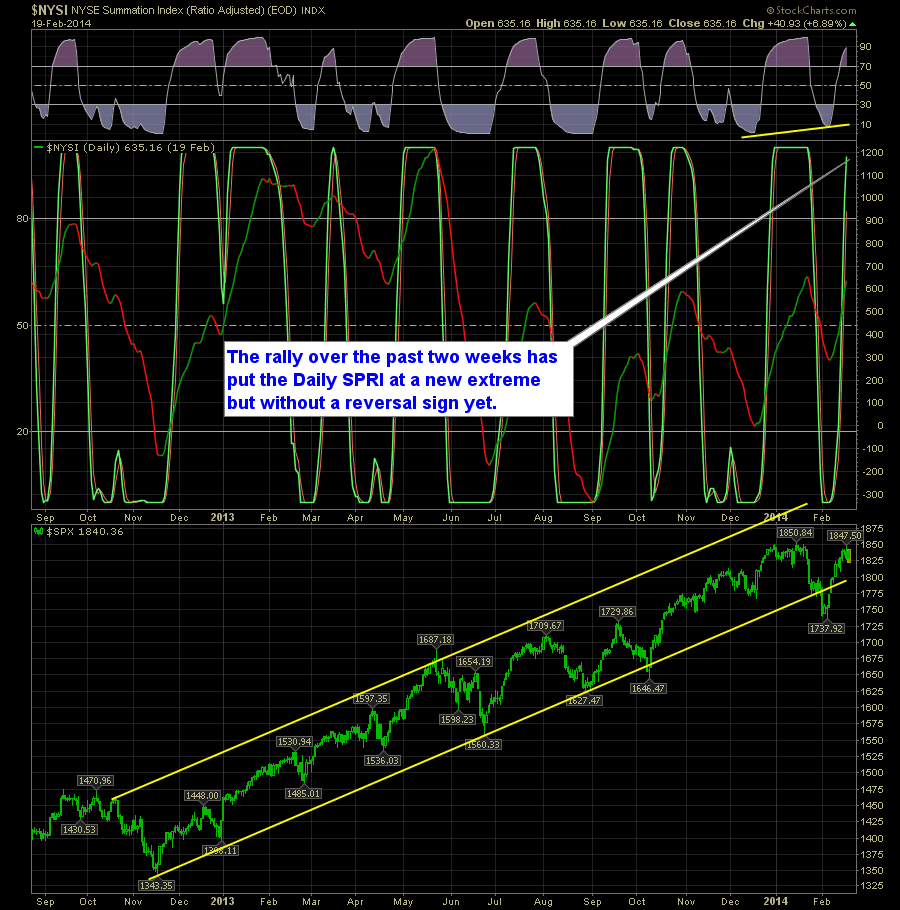
Of the last ten trading sessions, eight of them has resulted in the SPX finishing higher. On the daily chart the SPRI is undoubtedly nearing extremes that could see this rally fizzle out in the short-term some time next week.

The daily and the weekly SharePlanner Reversal Indicator is at odds with each other. On the daily chart you have a clear upside reversal and that has been backed up by the action we’ve seen out of SPX over the past 5 trading sessions. Here’s the Daily SPRI:
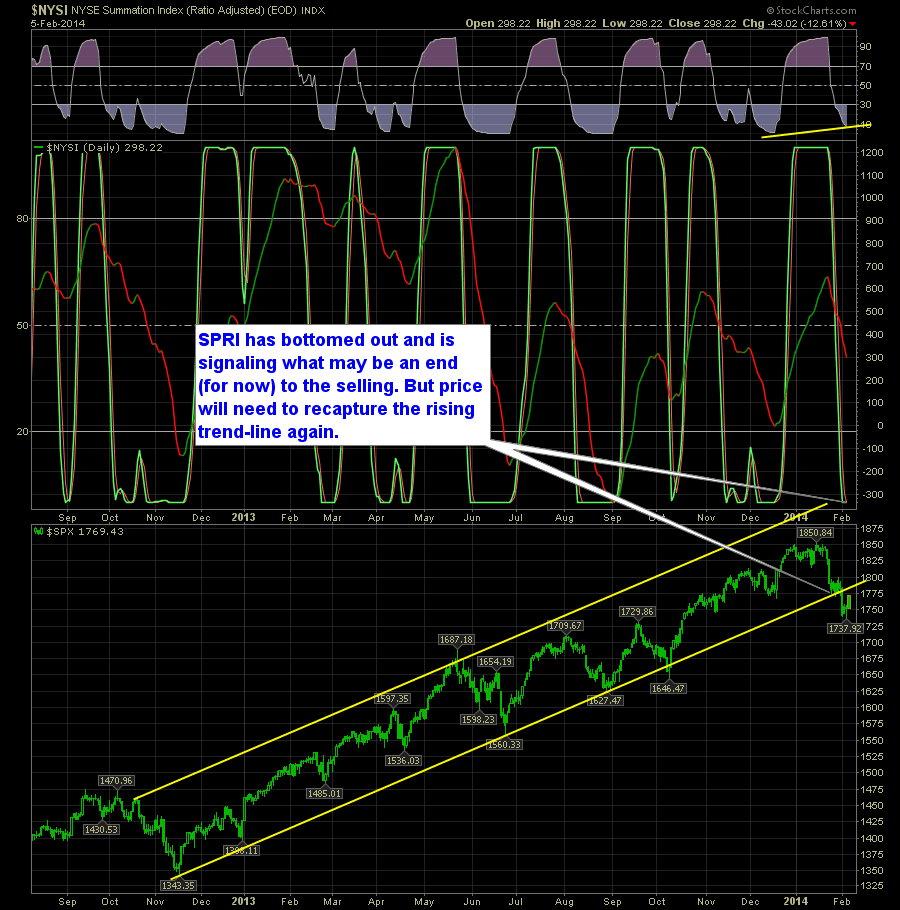
The SharePlanner Reversal Indicator is out and there is a glimmer of hope for the bulls that is also being reflected in the price action the past three days. On the Daily SPRI, it has clearly bottomed and looking for a reversal to the upside: Here’s the daily indicator:

The SharePlanner Reversal Indicator is glaringly bearish. On the daily chart the SPRI has the downtrend in full effect. However, the problem becomes the fact that we saw support kick in yesterday at the rising uptrend off of the lows from November of 2012. That is a significant trend-line that has seen support come in

Pre-market update: Asian markets traded 0.2% higher. European markets are trading flat. US futures are trading 0.1% higher ahead of the market open. Economic reports due out (all times are eastern): Housing Starts (8:30), Industrial Production (9:15), Consumer Sentiment (9:55) Technical Outlook (SPX): SPX continues to tap the all-time closing highs at 1849. What makes this

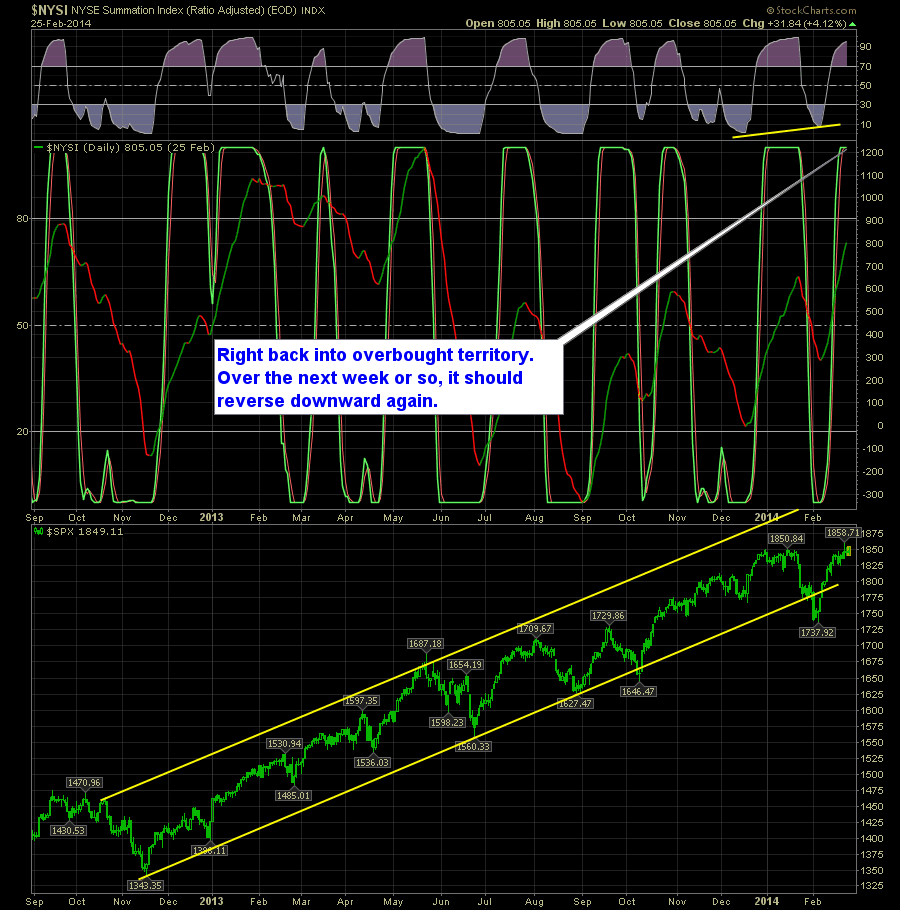
The SPRI, despite the shaky start to the month has managed to still trade at the upward extremes of the indicator. On the daily SPRI, for more than two weeks it has been trading at the extremes and in another week or so should start showing signs of coming off of those extremes. On
The SharePlanner Indicator is showing signs that the current market rally that began off of the 12/18 lows may be getting exhausted. If that is the case, it becomes much more critical for the S&P 500 to establish new highs in the short-term as soon as possible. On the daily it is currently at extremes

spc@shareplanner.com
(904) 800-8420
© Copyright 2025 | SharePlanner Inc. All Rights Reserved.
Disclaimer: The information provided on this website is for educational and informational purposes only. Ryan Mallory and/or SharePlanner are not licensed financial advisors, brokers, or tax professionals. The content on this site should not be considered as financial, investment, tax, or legal advice.
All information and opinions expressed herein are based on sources believed to be accurate and reliable. However, we make no representation or warranty as to their accuracy, completeness, or reliability. Any action you take upon the information on this website is strictly at your own risk.
Past performance is not indicative of future results. Investing involves risk, including the possible loss of principal. All investors should make their own decisions based on their specific investment objectives and financial circumstances.
This site may contain links to external websites that are not provided or maintained by or in any way affiliated with Ryan Mallory and/or SharePlanner. Please note that Ryan Mallory and/or SharePlanner do not guarantee the accuracy, relevance, timeliness, or completeness of any information on these external websites.
By using this website, you agree that Ryan Mallory and/or SharePlanner and any affiliated parties are not responsible for any losses or damages resulting from your use of or reliance on the information provided.
It is strongly recommended that you consult with a qualified professional before making any financial decisions.