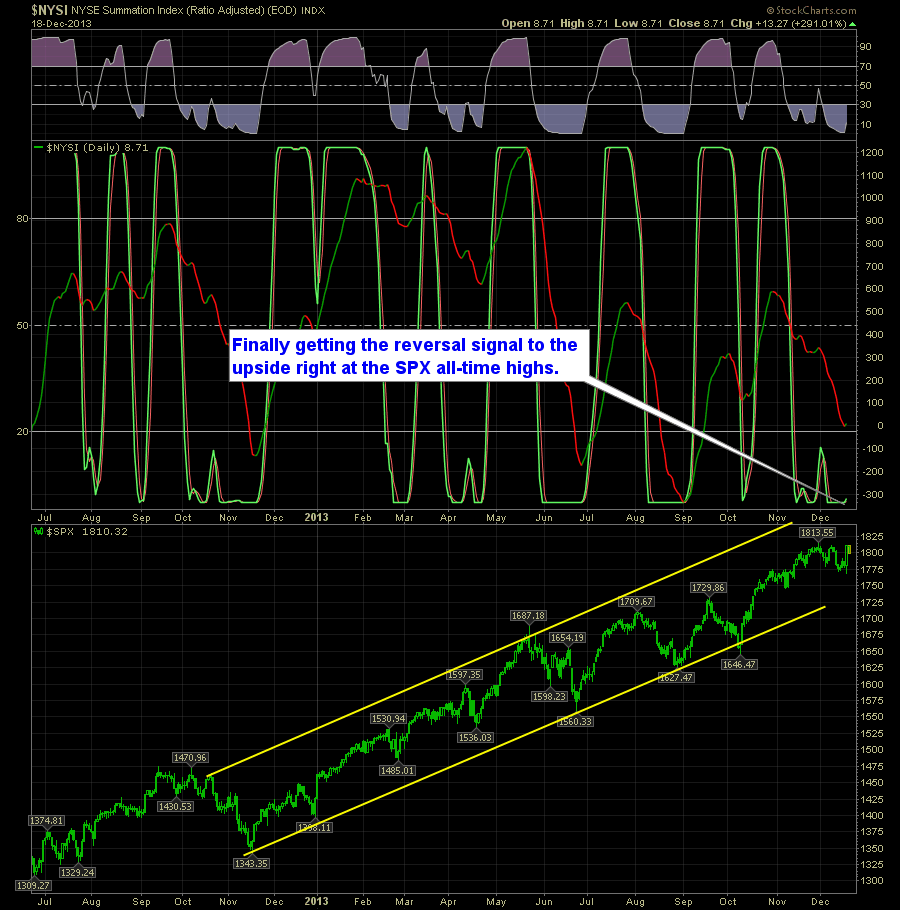
The markets shocked the talking heads world yesterday when it decided to rally off of news that the Fed would begin tapering. That’s why opinions of people who hold their thinking capacities in high esteem are dangerous thing when it comes to the stock market. So trade what the market is showing you, and not
A month ago when the SharePlanner Reversal Indicator was showing a down side reversal. We kind of got that in the form of massive consolidation, which is always a strong outcome for a downside reversal on the SPRI when you are in the midst of a strong bullish uptrend. Since about 11/14 we have been essentially stuck

Pre-market update: Asian markets traded 1.0% lower. European markets are trading flat. US futures are trading 0.1% higher ahead of the market open. Economic reports due out (all times are eastern): Challenger Job-Cut Report (7:30), GDP (8:30), Jobless Claims (8:30), Corporate Profits (8:30), Factory Orders (10), EIA Natural Gas Report (10:30), Treasury STRIPS (3) Technical Outlook


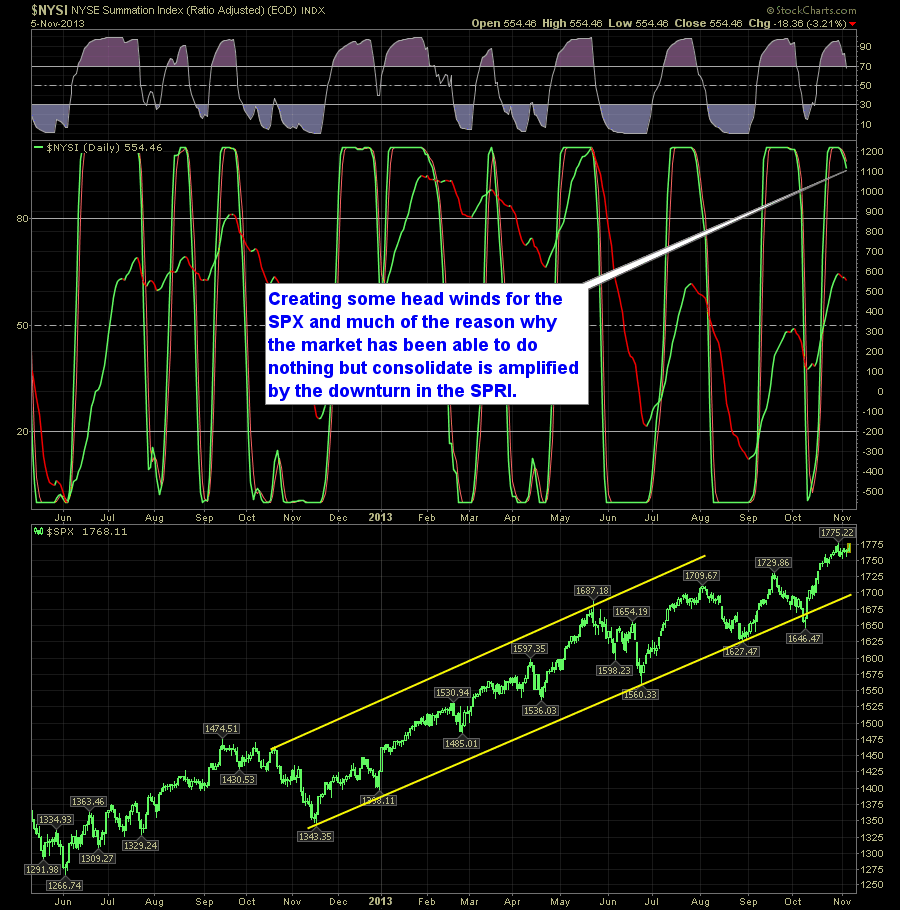
This pattern is really making me uneasy about having a heavily bullish portfolio. It is also the main reason why I haven’t added any new long positions today at all. We are also up seven straight weeks. Since the March 2009 bottom (that is as far back as I went), eight straight weeks is unheard

It is getting tough in this market to decipher what the charts are trying to tell us when it comes to the SharePlanner Reversal Indicator. Primarily because I use both a daily and a weekly version and try to make sense out of both. So when the two time frames may be giving conflicted messages,
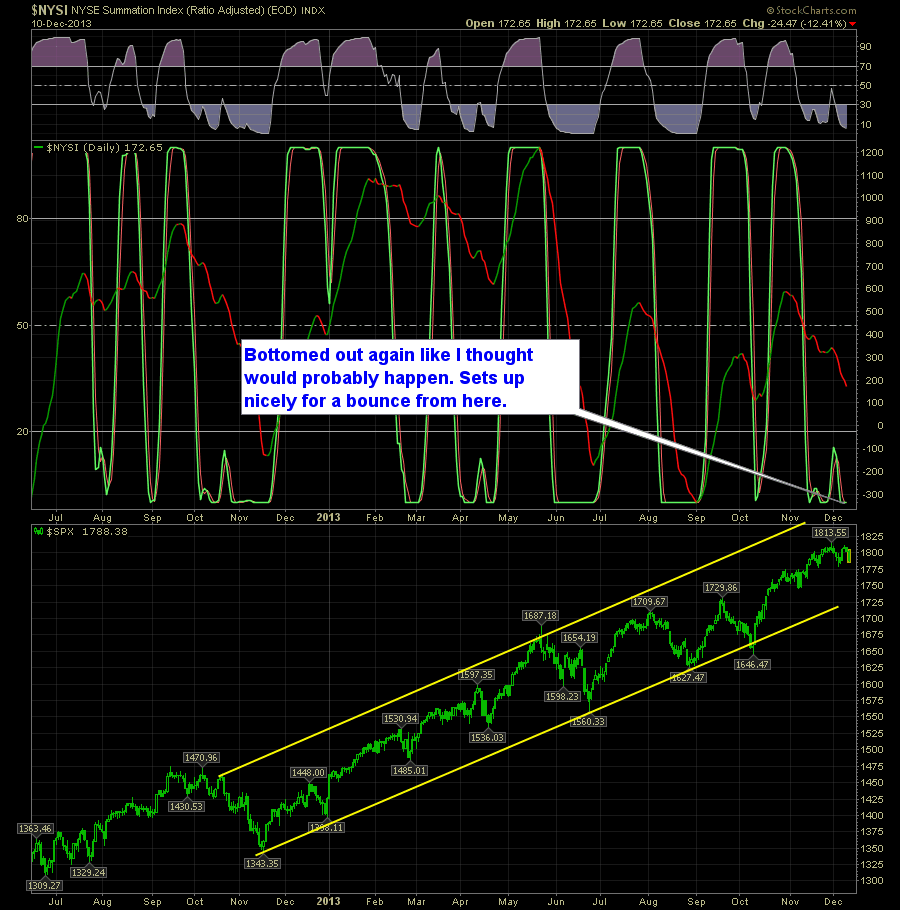
The Daily SharePlanner Reversal Indicator is showing that the downside may be losing some steam, and could see an upside reversal in the coming days: However the weekly, while also showing a current downtrend, is no where near bouncing. In fact it is just beginning: So how do we resove these mix messages, well, my guess
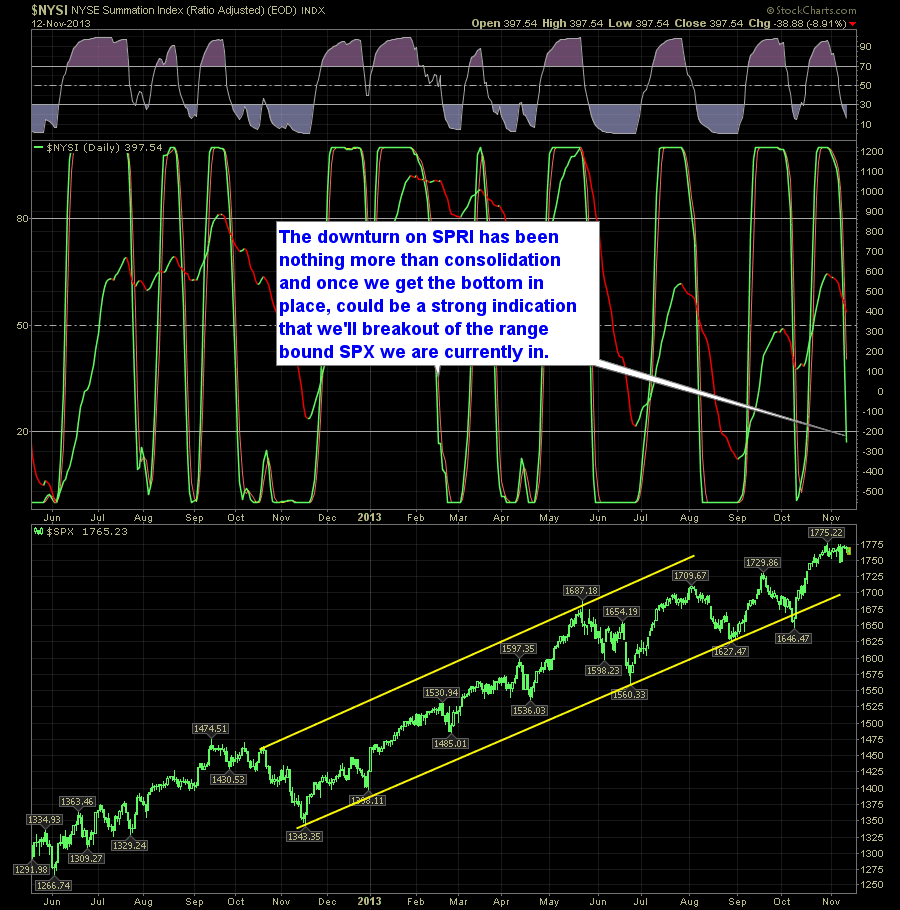
Not much has changed on the SharePlanner Reversal Indicator, but what it is doing is running in contradiction to the direction of the S&P 500 and other indices. This is most prominently seen in the Daily SPRI chart:

One of the subscribers to the SharePlanner Splash Zone sent me this picture last night, and it has been on my mind all day. Simply put, he overlapped the SPY with the T2107 chart, and what we get is mind boggling. Since June as the market is climbing higher and higher, fewer and fewer
Weekly video on the comings and goings of this market and how I’m trading. This week I focus specifically on the potential bear case I saw unfold after the FOMC statement was released, my increased short exposure, and the dip-buyers keeping this market propped up today. I’ll also go over how I’ll adjust my

spc@shareplanner.com
(904) 800-8420
© Copyright 2025 | SharePlanner Inc. All Rights Reserved.
Disclaimer: The information provided on this website is for educational and informational purposes only. Ryan Mallory and/or SharePlanner are not licensed financial advisors, brokers, or tax professionals. The content on this site should not be considered as financial, investment, tax, or legal advice.
All information and opinions expressed herein are based on sources believed to be accurate and reliable. However, we make no representation or warranty as to their accuracy, completeness, or reliability. Any action you take upon the information on this website is strictly at your own risk.
Past performance is not indicative of future results. Investing involves risk, including the possible loss of principal. All investors should make their own decisions based on their specific investment objectives and financial circumstances.
This site may contain links to external websites that are not provided or maintained by or in any way affiliated with Ryan Mallory and/or SharePlanner. Please note that Ryan Mallory and/or SharePlanner do not guarantee the accuracy, relevance, timeliness, or completeness of any information on these external websites.
By using this website, you agree that Ryan Mallory and/or SharePlanner and any affiliated parties are not responsible for any losses or damages resulting from your use of or reliance on the information provided.
It is strongly recommended that you consult with a qualified professional before making any financial decisions.