
The stock market has experienced a lot of selling of late, and for swing-traders the prospect of knowing whether to hold a trade over night or multiple trades for that matter is very difficult. But this video has been put together to help you determine how to trade these difficult markets and to know when
Sectors overall in rough shape, but promising charts emerge. Today the market made a dramatic turnaround off of its lows of the day. It was a much needed boost for the market which had yet to produce a green day even once in the previous five trading sessions. However, I’m concerned that it could be
October’s sell-off had plenty of drama. Headlines and tons and tons of volume and extreme oversold readings on pretty much every indicator that ever existed. November hasn’t been anything like that, which has been what has made it so complicated. The breadth has not been bad at all. In fact, the T2108 indicator, which measures
Old and broken trend lines trying to stall out the current market rally. The market is trying to sell off, though since the 2:30 turn, the bulls have been on an ungodly buying spree, wiping out half of the day's losses, and inspiring the bulls that the worst may be behind it. Where this market

Information received since the Federal Open Market Committee met in September indicates that the labor market has continued to strengthen and that economic activity has been rising at a strong rate. Job gains have been strong, on average, in recent months, and the unemployment rate has declined. Household spending has continued to grow strongly, while

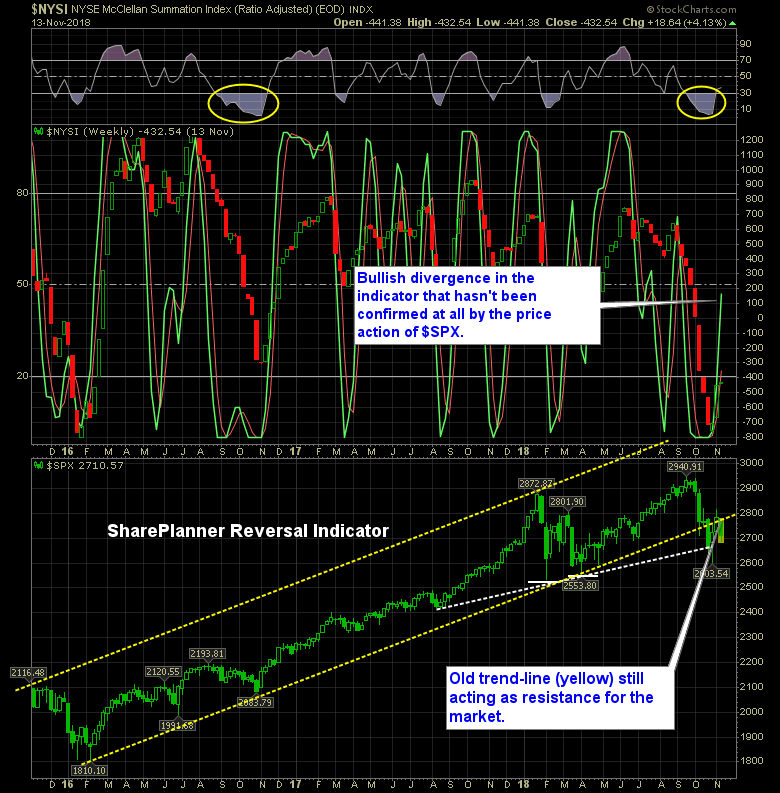
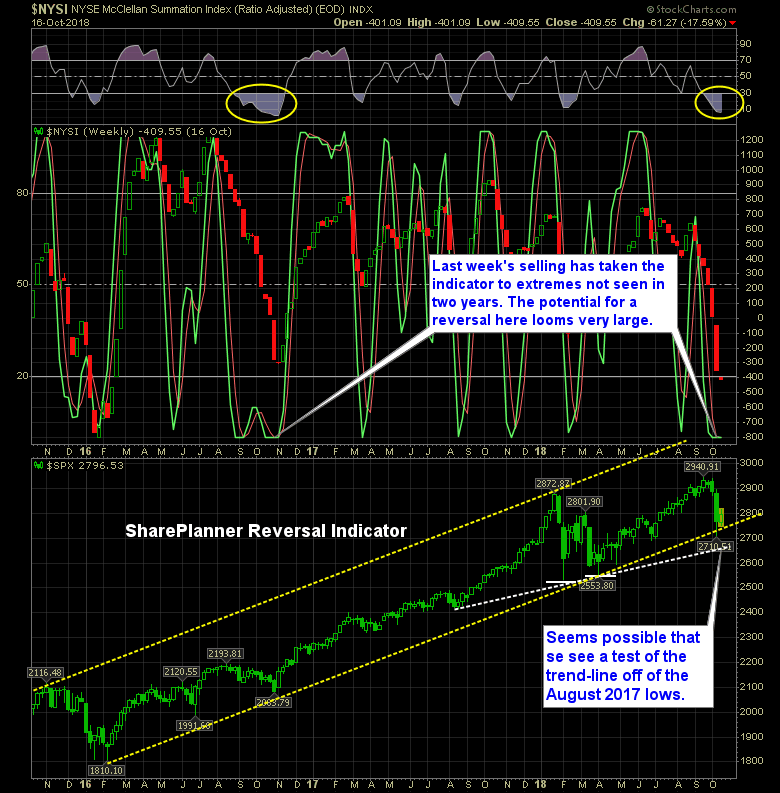
October was a hard market for the bulls, but their time may finally have arrived. The latest installment of the SharePlanner Reversal Indicator shows that the bulls have finally managed to trigger a bullish reversal. The previous two times this happened at extremes, the reversals were short lived and failed to hit bullish extremes, and
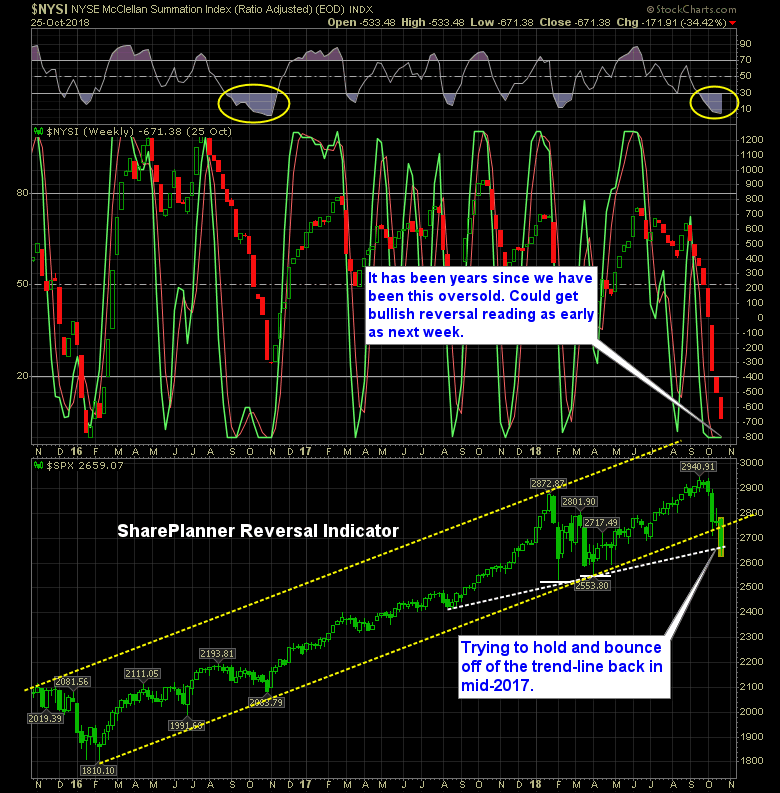
If my aim is to be totally PC about all of this, I would answer with “I don’t know” or the classic economic line of “it depends”. What I personally think though, is that this market is clearly as oversold as it has been in ages. A full month of non-stop selling. In fact there
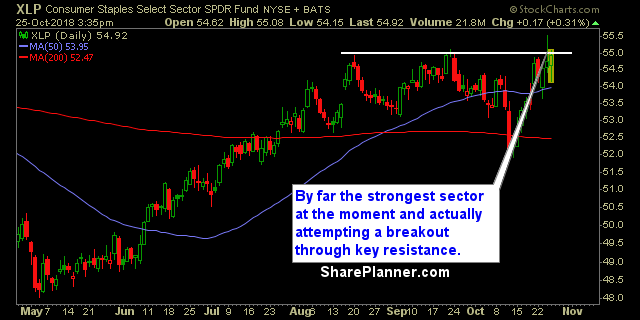
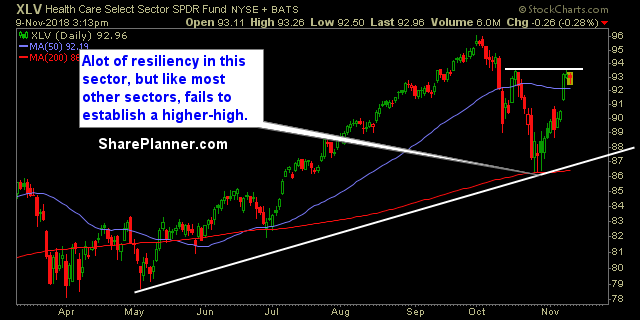
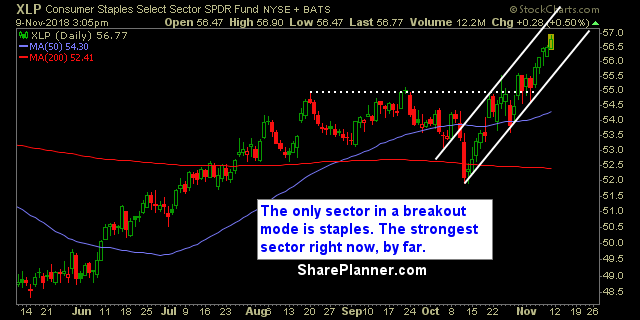
Technicals are pretty much a disaster for all the sectors. Except for Staples and Utilities, which are actually on the up and up, but that is to be expected when the street is looking for safe havens for its capital. The bulls have suffered for five weeks strong, and it is showing on the charts
I know there are a lot of you bears out there dying to reshort this market, assuming it is just a dead cat bounce. And you may get that change eventually, but be patient. Don't try to force it. These bounces take time to play out. The bounce, following the February lows being established on
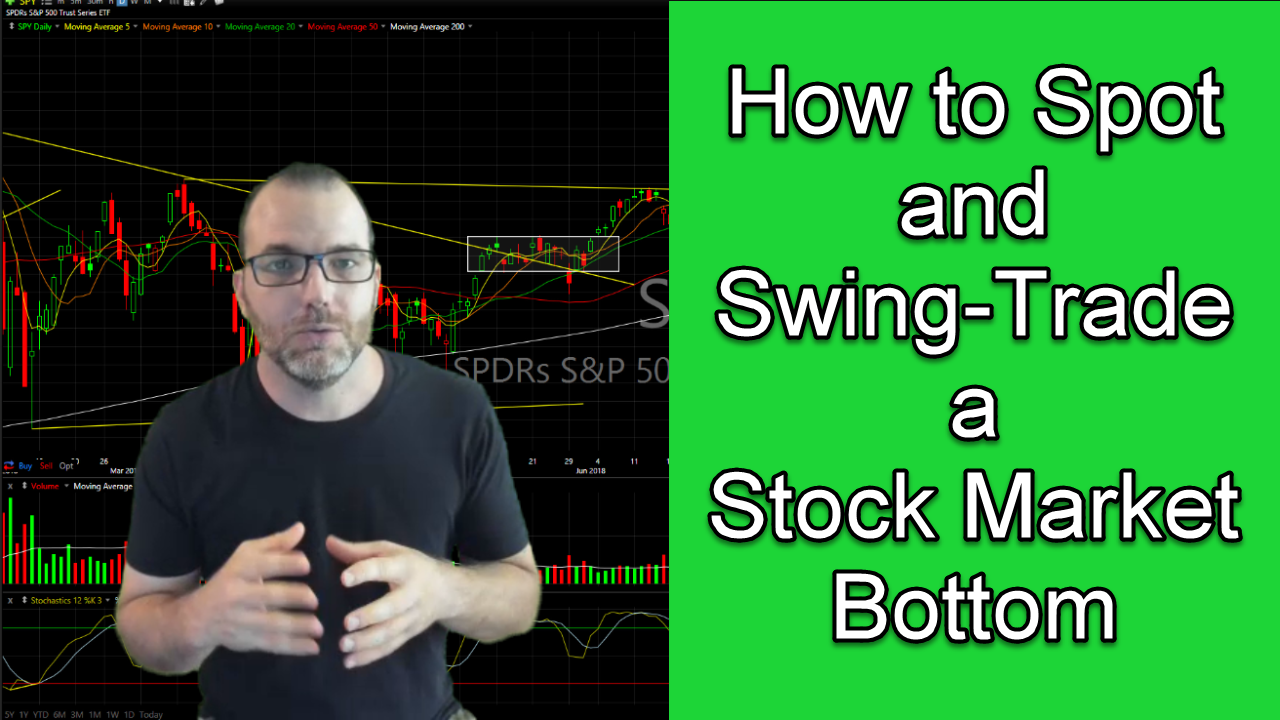
The stock market is seeing huge amounts of selling, and in some cases even crashing. How do you know when a bottom has been put in place and buy the dip? In this video I lay out my entire approach to trading a stock market crash and how to identify a bottom and do so

spc@shareplanner.com
(904) 800-8420
© Copyright 2025 | SharePlanner Inc. All Rights Reserved.
Disclaimer: The information provided on this website is for educational and informational purposes only. Ryan Mallory and/or SharePlanner are not licensed financial advisors, brokers, or tax professionals. The content on this site should not be considered as financial, investment, tax, or legal advice.
All information and opinions expressed herein are based on sources believed to be accurate and reliable. However, we make no representation or warranty as to their accuracy, completeness, or reliability. Any action you take upon the information on this website is strictly at your own risk.
Past performance is not indicative of future results. Investing involves risk, including the possible loss of principal. All investors should make their own decisions based on their specific investment objectives and financial circumstances.
This site may contain links to external websites that are not provided or maintained by or in any way affiliated with Ryan Mallory and/or SharePlanner. Please note that Ryan Mallory and/or SharePlanner do not guarantee the accuracy, relevance, timeliness, or completeness of any information on these external websites.
By using this website, you agree that Ryan Mallory and/or SharePlanner and any affiliated parties are not responsible for any losses or damages resulting from your use of or reliance on the information provided.
It is strongly recommended that you consult with a qualified professional before making any financial decisions.