
If my aim is to be totally PC about all of this, I would answer with “I don’t know” or the classic economic line of “it depends”.
What I personally think though, is that this market is clearly as oversold as it has been in ages. A full month of non-stop selling. In fact there have only been five days this month where the market has finished higher on the day. Better said, 20 of the last 25 trading sessions have finished in the red.
That’s a rarity, in fact it is a rarity for any market at any time.
We are severely overextended to the downside, and my favorite reading of determining market bounces is the T2108 indicator which measures the percentage of stocks trading above their 40-day moving average. Right now that reading sits in the single digits of about 8-9%, but trying to bounce back into the double digits. Anytime it gets that low, the stay is brief, and the result is a massive dead cat bounce that squeezes the life out of the shorts.
So far we haven’t had that, and we had a similar reading back on October 11th. So to get two back to back readings like that without a sustained bounce, is eye-opening.
Below you have my SharePlanner Reversal Indicator – it has flat lined, and that rarely happens. A bounce next week makes it possible that we see a bullish reversal in the indicator, but stay careful out there as it tries to play out.
Here’s the SPRI: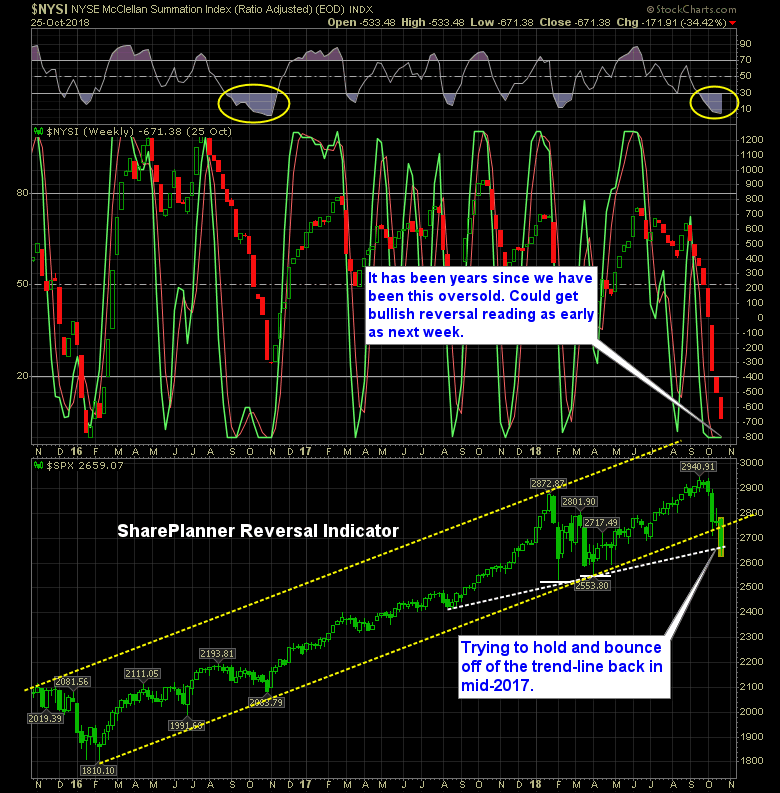


Welcome to Swing Trading the Stock Market Podcast!
I want you to become a better trader, and you know what? You absolutely can!
Commit these three rules to memory and to your trading:
#1: Manage the RISK ALWAYS!
#2: Keep the Losses Small
#3: Do #1 & #2 and the profits will take care of themselves.
That’s right, successful swing-trading is about managing the risk, and with Swing Trading the Stock Market podcast, I encourage you to email me (ryan@shareplanner.com) your questions, and there’s a good chance I’ll make a future podcast out of your stock market related question.
In today's episode, at episode 500, I am diving into the lessons learned from trading over the last 100 episodes, because as traders we are evolving and always attempting to improve our skillset. So here is to episode 500, and to another 500 episodes of learning and developing as swing traders in the stock market!
Be sure to check out my Swing-Trading offering through SharePlanner that goes hand-in-hand with my podcast, offering all of the research, charts and technical analysis on the stock market and individual stocks, not to mention my personal watch-lists, reviews and regular updates on the most popular stocks, including the all-important big tech stocks. Check it out now at: https://www.shareplanner.com/premium-plans
📈 START SWING-TRADING WITH ME! 📈
Click here to subscribe: https://shareplanner.com/tradingblock
— — — — — — — — —
💻 STOCK MARKET TRAINING COURSES 💻
Click here for all of my training courses: https://www.shareplanner.com/trading-academy
– The A-Z of the Self-Made Trader –https://www.shareplanner.com/the-a-z-of-the-self-made-trader
– The Winning Watch-List — https://www.shareplanner.com/winning-watchlist
– Patterns to Profits — https://www.shareplanner.com/patterns-to-profits
– Get 1-on-1 Coaching — https://www.shareplanner.com/coaching
— — — — — — — — —
❤️ SUBSCRIBE TO MY YOUTUBE CHANNEL 📺
Click here to subscribe: https://www.youtube.com/shareplanner?sub_confirmation=1
🎧 LISTEN TO MY PODCAST 🎵
Click here to listen to my podcast: https://open.spotify.com/show/5Nn7MhTB9HJSyQ0C6bMKXI
— — — — — — — — —
💰 FREE RESOURCES 💰
— — — — — — — — —
🛠 TOOLS OF THE TRADE 🛠
Software I use (TC2000): https://bit.ly/2HBdnBm
— — — — — — — — —
📱 FOLLOW SHAREPLANNER ON SOCIAL MEDIA 📱
*Disclaimer: Ryan Mallory is not a financial adviser and this podcast is for entertainment purposes only. Consult your financial adviser before making any decisions.
You Might Like

The Retail Trading Revolution: How Small Investors Are Reshaping the Stock Market

Fading the Gap: How Large Overnight Moves in SPY and QQQ Play Out During the Trading Day

How to Trade a Bear Flag