
October’s sell-off had plenty of drama. Headlines and tons and tons of volume and extreme oversold readings on pretty much every indicator that ever existed.
November hasn’t been anything like that, which has been what has made it so complicated. The breadth has not been bad at all. In fact, the T2108 indicator, which measures the percentage of stocks trading above their 40-day moving average, is still at 30%, which is only 10 points below its highs from earlier this month. At similar prices on SPX, we were seeing reading in the single digits on the T2108.
What about the short-term stochastics? Well, that isn’t even halfway towards being oversold at this point, and much of theses sell-offs, are not showing nowhere near the declines of 4 or 5-to-1 edge like we saw much of October. Not to mention the VIX is waaaaay below the levels seen just a few weeks ago.
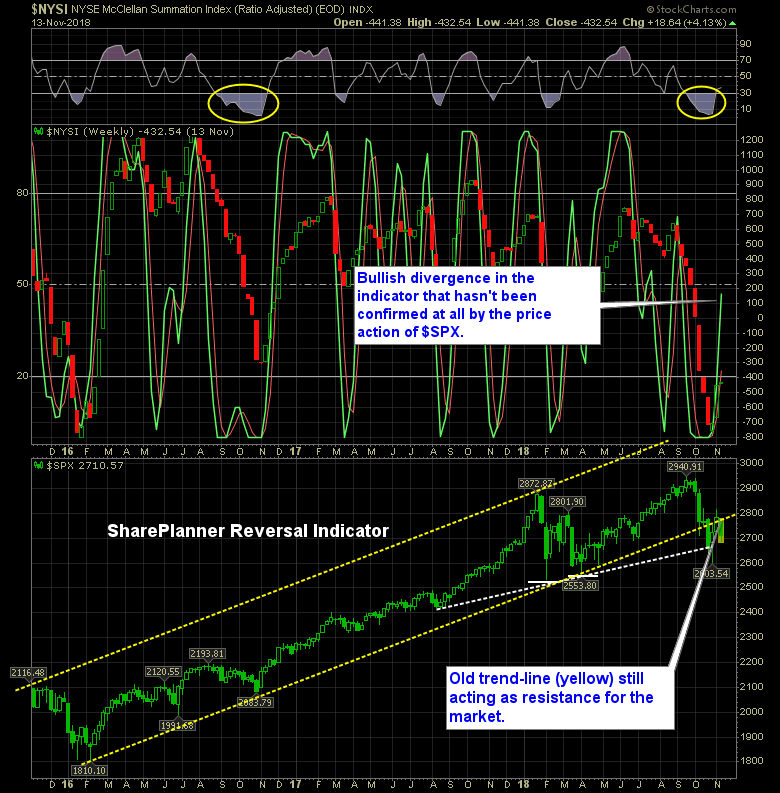
Now take the SharePlanner Reversal Indicator, and you have a bullish reading triggered last week, but price continues to go in the opposite direction.
So there is a lot of divergences working in the bulls favor. From a seasonal standpoint, this should be a favorable time for the market, but price still must cooperate. This afternoon, we saw some potential in this market to finally bounce, when it saw some heavy buying emerge this afternoon, to send price over 35 points off the lows of the day on SPX.
It just needs to continue that into the close and into tomorrow.
Here’s the SharePlanner Reversal Indicator:


Welcome to Swing Trading the Stock Market Podcast!
I want you to become a better trader, and you know what? You absolutely can!
Commit these three rules to memory and to your trading:
#1: Manage the RISK ALWAYS!
#2: Keep the Losses Small
#3: Do #1 & #2 and the profits will take care of themselves.
That’s right, successful swing-trading is about managing the risk, and with Swing Trading the Stock Market podcast, I encourage you to email me (ryan@shareplanner.com) your questions, and there’s a good chance I’ll make a future podcast out of your stock market related question.
Passive investing can be a great source of funds for retirement and for building a nest egg. In this podcast episode, a husband and wife asks Ryan's thoughts on building a SPY position on just $2/day. While consistent building a nest egg, is great, the timing and strategy in doing so is just as important.
Be sure to check out my Swing-Trading offering through SharePlanner that goes hand-in-hand with my podcast, offering all of the research, charts and technical analysis on the stock market and individual stocks, not to mention my personal watch-lists, reviews and regular updates on the most popular stocks, including the all-important big tech stocks. Check it out now at: https://www.shareplanner.com/premium-plans
📈 START SWING-TRADING WITH ME! 📈
Click here to subscribe: https://shareplanner.com/tradingblock
— — — — — — — — —
💻 STOCK MARKET TRAINING COURSES 💻
Click here for all of my training courses: https://www.shareplanner.com/trading-academy
– The A-Z of the Self-Made Trader –https://www.shareplanner.com/the-a-z-of-the-self-made-trader
– The Winning Watch-List — https://www.shareplanner.com/winning-watchlist
– Patterns to Profits — https://www.shareplanner.com/patterns-to-profits
– Get 1-on-1 Coaching — https://www.shareplanner.com/coaching
— — — — — — — — —
❤️ SUBSCRIBE TO MY YOUTUBE CHANNEL 📺
Click here to subscribe: https://www.youtube.com/shareplanner?sub_confirmation=1
🎧 LISTEN TO MY PODCAST 🎵
Click here to listen to my podcast: https://open.spotify.com/show/5Nn7MhTB9HJSyQ0C6bMKXI
— — — — — — — — —
💰 FREE RESOURCES 💰
— — — — — — — — —
🛠 TOOLS OF THE TRADE 🛠
Software I use (TC2000): https://bit.ly/2HBdnBm
— — — — — — — — —
📱 FOLLOW SHAREPLANNER ON SOCIAL MEDIA 📱
*Disclaimer: Ryan Mallory is not a financial adviser and this podcast is for entertainment purposes only. Consult your financial adviser before making any decisions.
You Might Like

How to Trade Breakouts Without Getting Trapped

Managing Headline Risk: How to Survive the News Cycle Without Losing Your Mind

What to Do After a Winning Trade