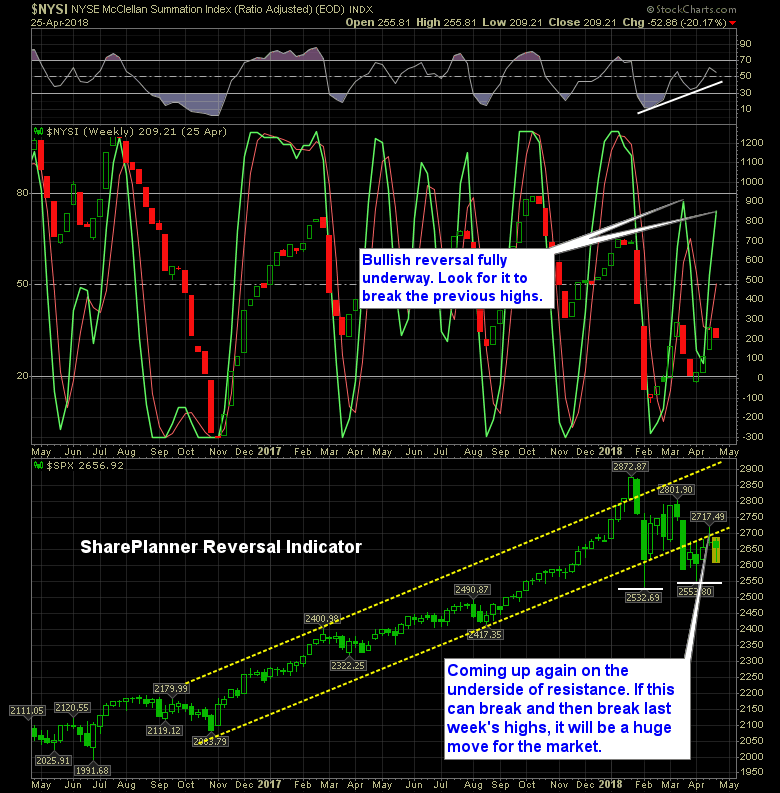
The bulls can make it happen here as April quickly comes to a close. Last week the bullish reversal signal came through for the market, and while, it hasn’t been a clean ride, some substantial improvement in the market’s technicals can be had here.
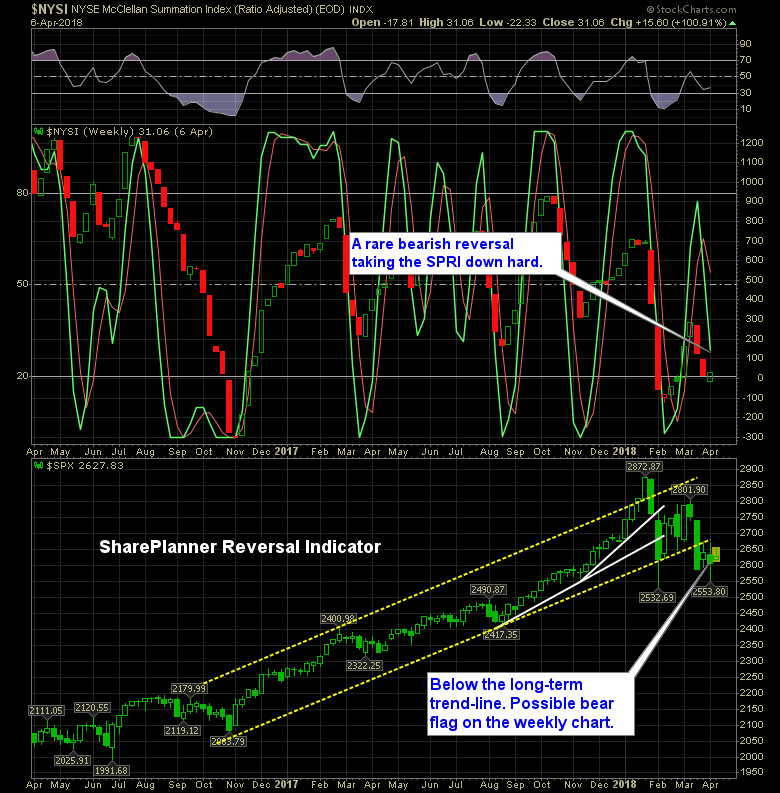
Last week I said we should see a bullish reversal in this market very soon. This week, the SharePlanner Reversal Indicator gave us exactly that.
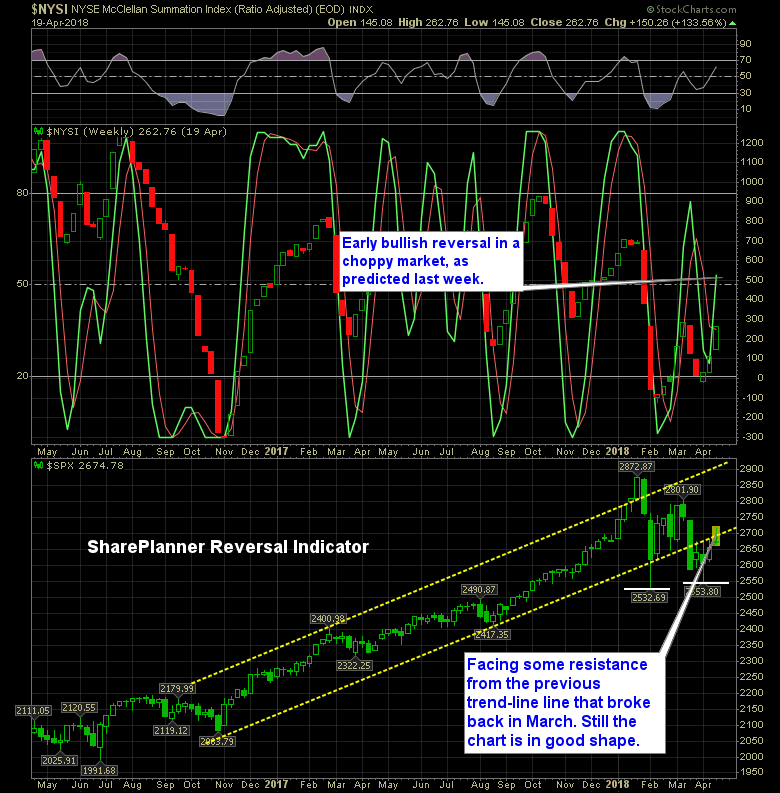
The Reversal Indicator is starting to see some willingness for a reversal back to the upside. The choppiness in the market of late, and over the last three weeks, where price has seen day-to-day reversals, is starting to show up in the SPRI with its early bearish reversal last week, and the possibility of a
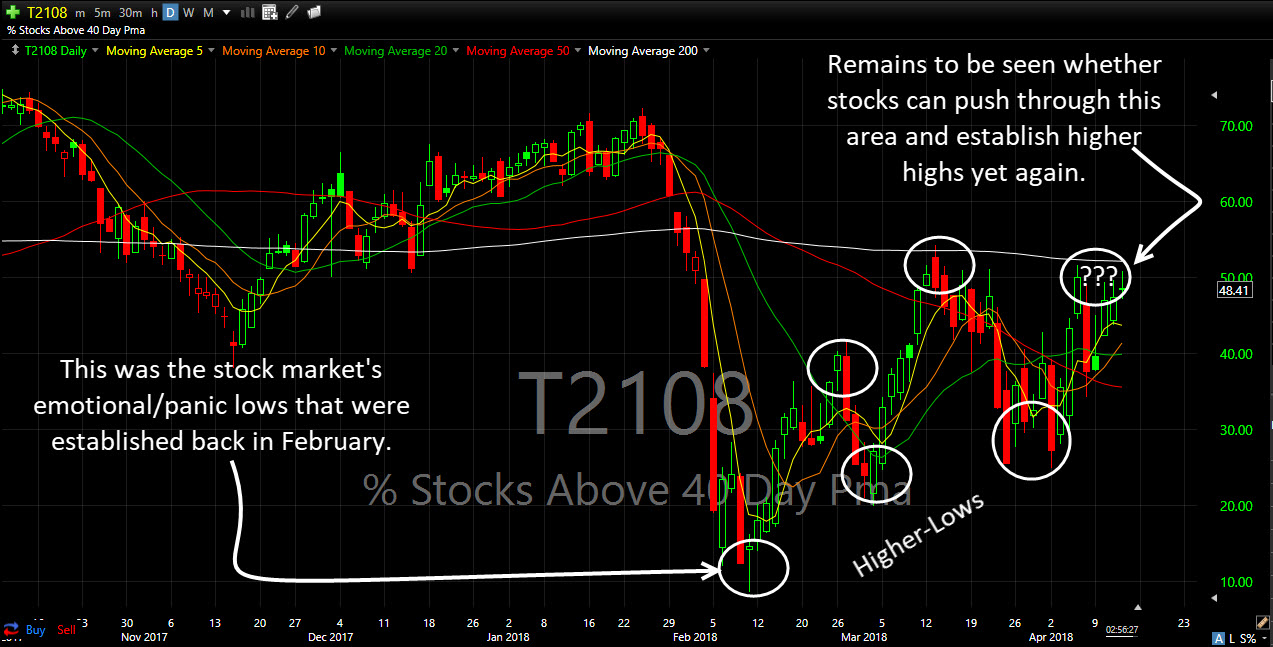
T2108 bullish divergences still in full effect I don’t tend to post the T2108 chart all that often, but I have lately because it does a much better job of forecasting and determining market direction following a major market sell-off.
Some good and bad in the market right now. Despite some willingness by the market to try and rally in recent days, there is still a lot of pressure weighing on the sectors across the board. The headline risk is at extreme levels, and that is keeping me from being too aggressive on the long
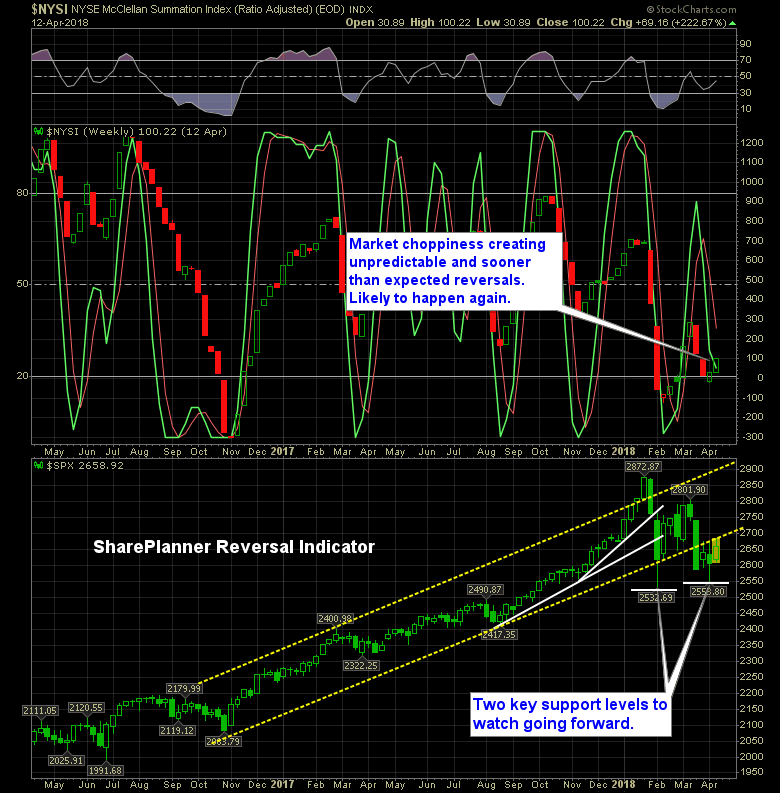
Typically you see the market hit extremes in either direction before seeing any kind of reversal on the charts. Well, not so here, as the bears managed to reverse course of what was shaping up to be a possible reversal to the upside, only to get smashed to pieces over the past month with additional
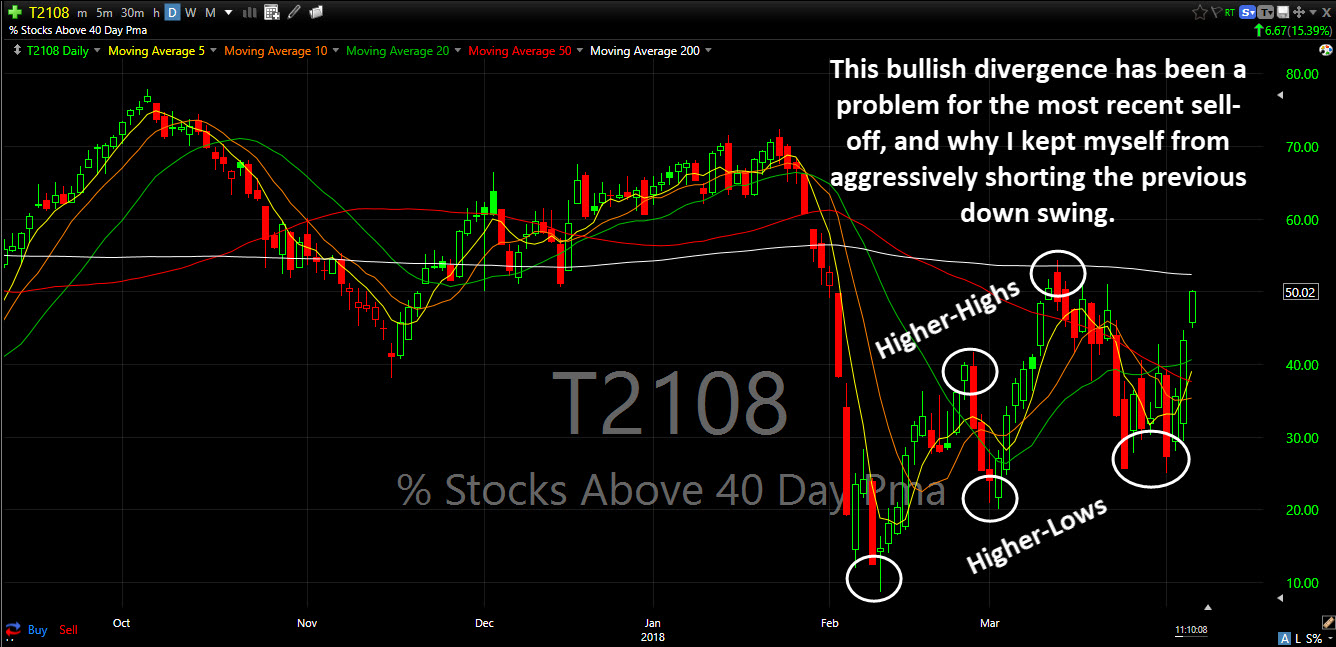
While I dipped my toes to the short side during the month of March, I didn’t nearly capitalize as much as I could have that month. That is because of this T2108 chart, which measures the percentage of stocks trading above their 40-day moving average.
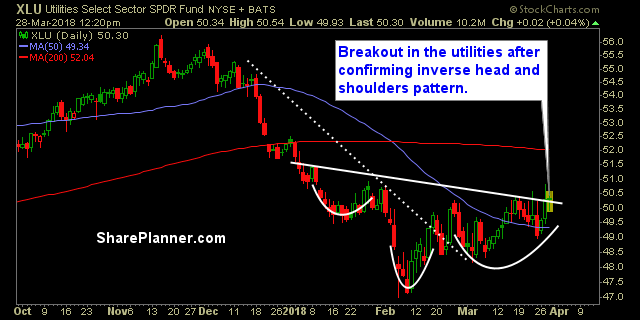
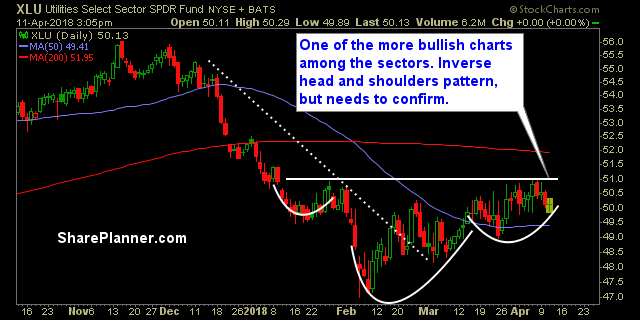
There are drastic differences in each of the sectors That is usually not the case. They tend to represent some off-shoot of the S&P 500, or in the case of Technology, as resemblance of the Nasdaq chart. But now, each chart has a different look. obviously the majority of them are trending downwards, but still
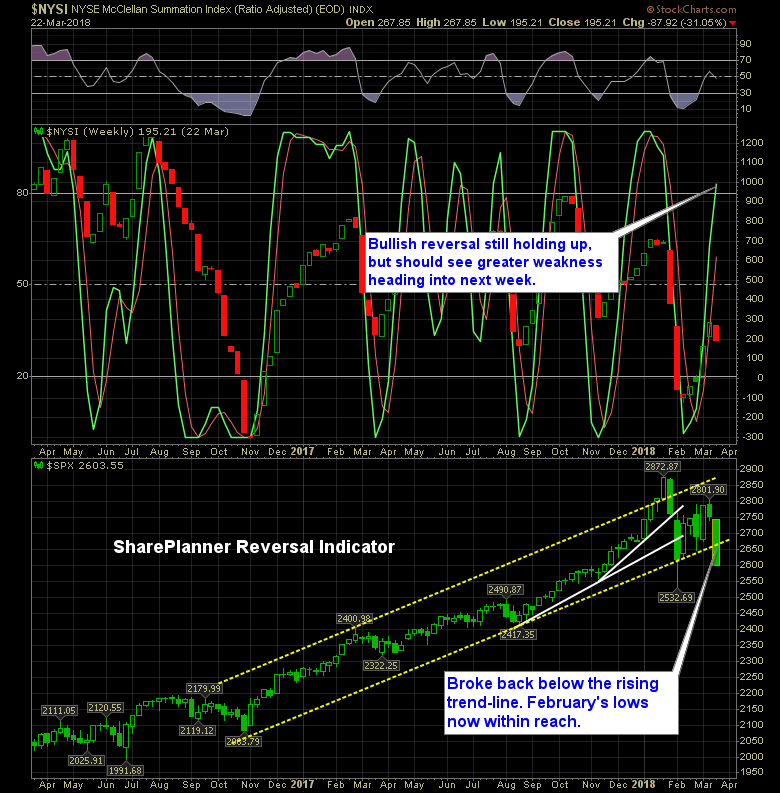
This has not been a good week for the bulls. They have fully lost control of the market. When I pulled up the SharePlanner Reversal Indicator, I fully expected it to show a bearish reversal in the works, but it is still riding strong to the upside. Of course, it hasn’t priced today’s action just

Information received since the Federal Open Market Committee met in January indicates that the labor market has continued to strengthen and that economic activity has been rising at a moderate rate. Job gains have been strong in recent months, and the unemployment rate has stayed low. Recent data suggest that growth rates of household spending

spc@shareplanner.com
(904) 800-8420
© Copyright 2025 | SharePlanner Inc. All Rights Reserved.
Disclaimer: The information provided on this website is for educational and informational purposes only. Ryan Mallory and/or SharePlanner are not licensed financial advisors, brokers, or tax professionals. The content on this site should not be considered as financial, investment, tax, or legal advice.
All information and opinions expressed herein are based on sources believed to be accurate and reliable. However, we make no representation or warranty as to their accuracy, completeness, or reliability. Any action you take upon the information on this website is strictly at your own risk.
Past performance is not indicative of future results. Investing involves risk, including the possible loss of principal. All investors should make their own decisions based on their specific investment objectives and financial circumstances.
This site may contain links to external websites that are not provided or maintained by or in any way affiliated with Ryan Mallory and/or SharePlanner. Please note that Ryan Mallory and/or SharePlanner do not guarantee the accuracy, relevance, timeliness, or completeness of any information on these external websites.
By using this website, you agree that Ryan Mallory and/or SharePlanner and any affiliated parties are not responsible for any losses or damages resulting from your use of or reliance on the information provided.
It is strongly recommended that you consult with a qualified professional before making any financial decisions.