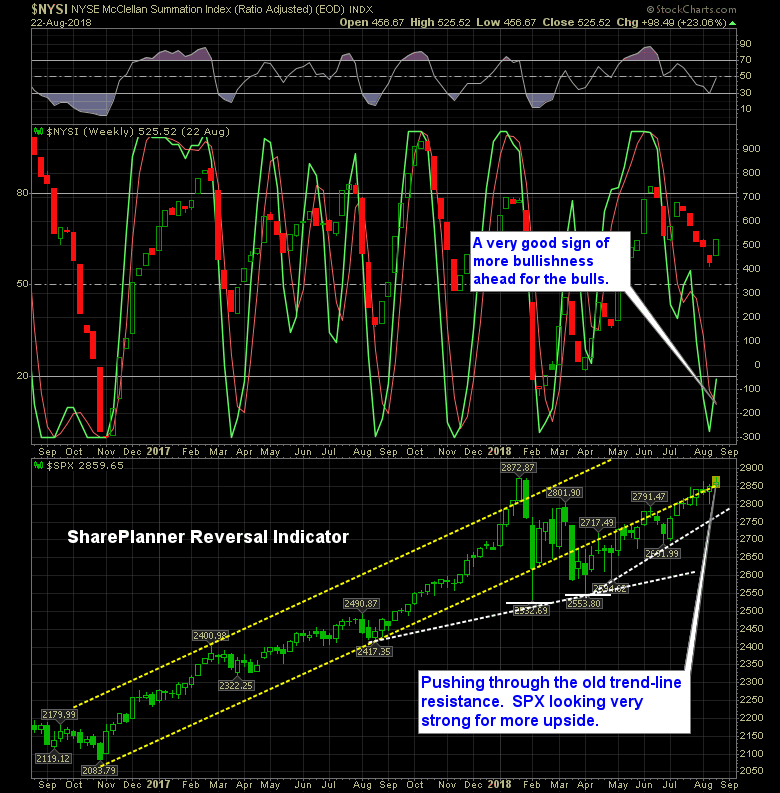
Sure, everyone in the market is waiting for some Trump headline to hit that shakes the market to its core. But you could be waiting a while (or it may not ever happen), and in the meantime, the SharePlanner Reversal Indicator is the most bullish it has been since the market bottomed back on February
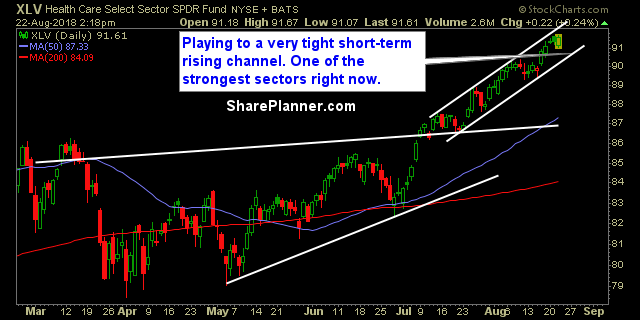
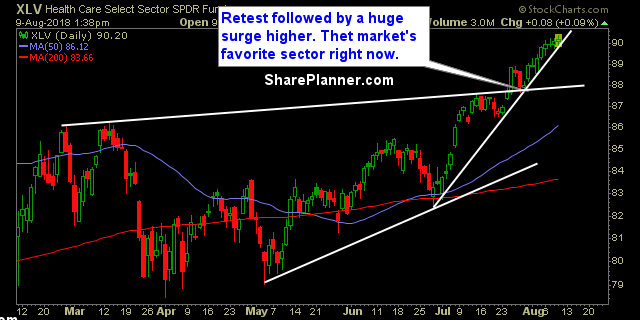
Sectors as a whole support the market’s move to new all-time highs. Outside of Energy and Materials, the sectors as a whole have shown some solid trend-lines and a willingness to push higher going forward.
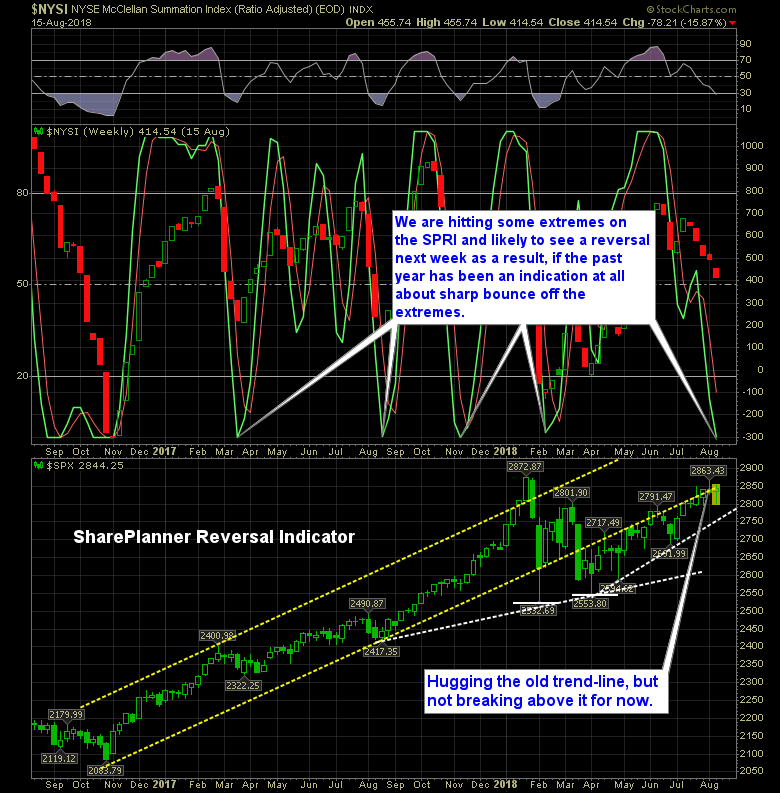
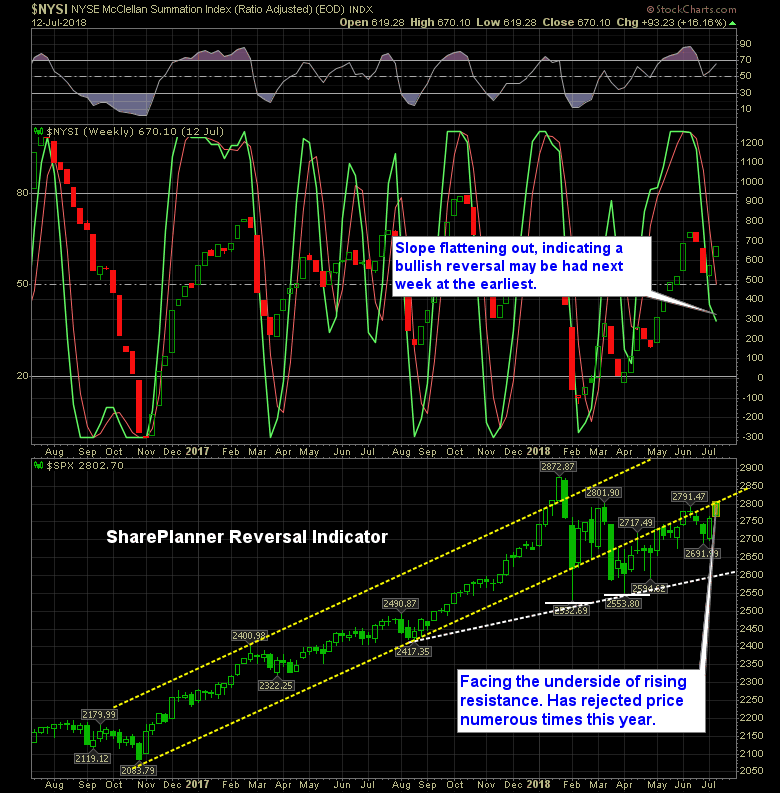
We thought there might have been an early bullish reversal a month ago, but that didn’t pan out, and the downside continued for the market. But now the SharePlanner Reversal Indicator is at an extreme place, and recent history (over the past year), suggests its time in the extremes is short lived. That’s why I
Most of the sectors are showing sideways trading patterns. The market isn't entirely untradeable but it is getting pretty darn close to it. I'm finding the breakout plays to be more difficult than most, and instead focusing on the stocks that are forming a base and coming out of that base, following a sell-off. Most
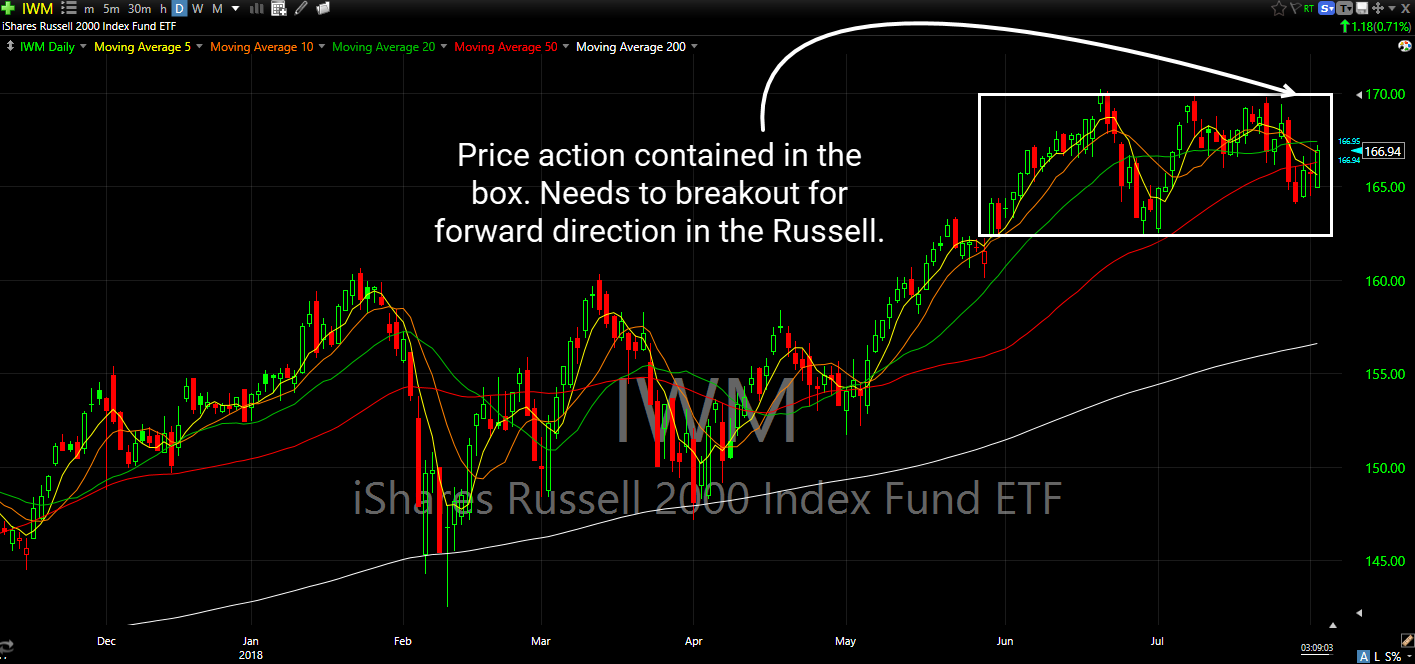
Each of the indices are telling a different story, and they can shift quite regularly. But after the surprising, not-so-surprising bounce off the lows of the day, to rip the hearts right out of the bears, the markets are showing themselves to be willing to push higher – particularly the Nasdaq and S&P 500.

Information received since the Federal Open Market Committee met in June indicates that the labor market has continued to strengthen and that economic activity has been rising at a strong rate. Job gains have been strong, on average, in recent months, and the unemployment rate has stayed low. Household spending and business fixed investment have
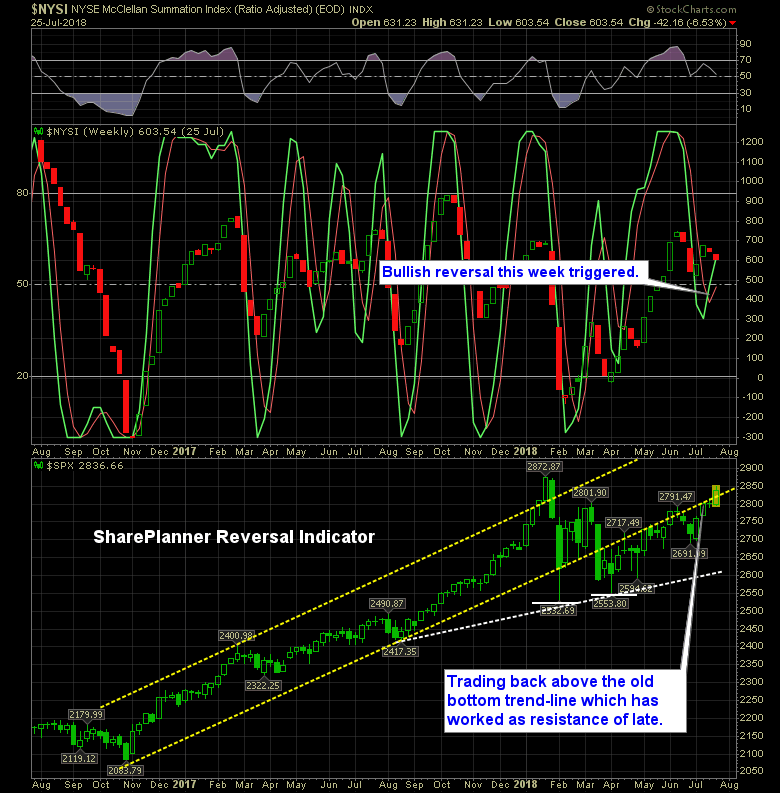
The bearish reversal in June is no more. The bulls have managed to correct the ship and put together a bullish reversal of their own. With strong price action over the last three weeks, market behaviors confirms the reading on the SPRI.
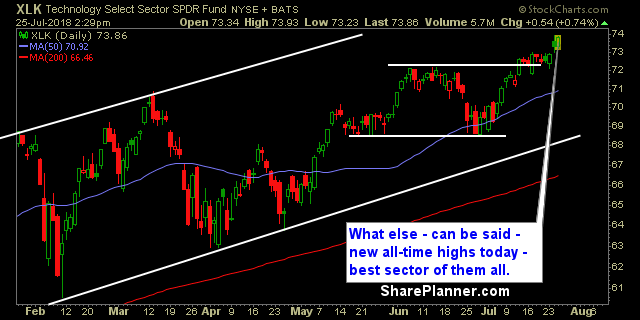
Reviewing the sector charts - there is plenty to like, from a bullish perspective. Pretty much every sector I looked at, I could find myself a reason for why there could be a bullish take on it. So overall, the charts aren't all that bad. What I am concerned with more than anything else, is
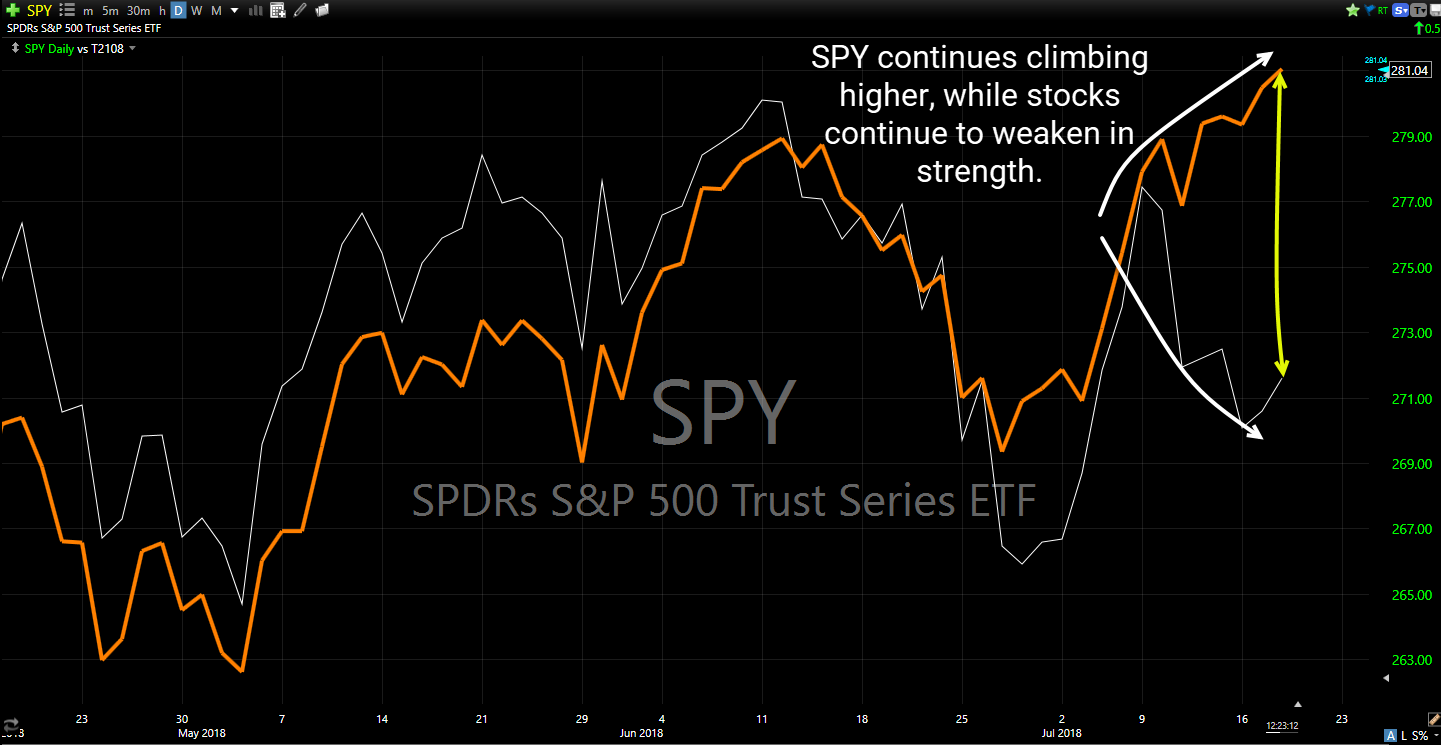
A divergence is popping up on the charts that was the same as the one seen back in late January. Of course that divergence ultimatley led to the massive -10% correction off of the all-time highs.
The bulls are up to their old ways of doing things again. Sure the tariffs are still lingering as an issue. Yes, there is no way to know what North Korea will ultimately do. Oh and at any moment, Bobby Mueller could rattle the markets with an announcement of his own.

spc@shareplanner.com
(904) 800-8420
© Copyright 2025 | SharePlanner Inc. All Rights Reserved.
Disclaimer: The information provided on this website is for educational and informational purposes only. Ryan Mallory and/or SharePlanner are not licensed financial advisors, brokers, or tax professionals. The content on this site should not be considered as financial, investment, tax, or legal advice.
All information and opinions expressed herein are based on sources believed to be accurate and reliable. However, we make no representation or warranty as to their accuracy, completeness, or reliability. Any action you take upon the information on this website is strictly at your own risk.
Past performance is not indicative of future results. Investing involves risk, including the possible loss of principal. All investors should make their own decisions based on their specific investment objectives and financial circumstances.
This site may contain links to external websites that are not provided or maintained by or in any way affiliated with Ryan Mallory and/or SharePlanner. Please note that Ryan Mallory and/or SharePlanner do not guarantee the accuracy, relevance, timeliness, or completeness of any information on these external websites.
By using this website, you agree that Ryan Mallory and/or SharePlanner and any affiliated parties are not responsible for any losses or damages resulting from your use of or reliance on the information provided.
It is strongly recommended that you consult with a qualified professional before making any financial decisions.