
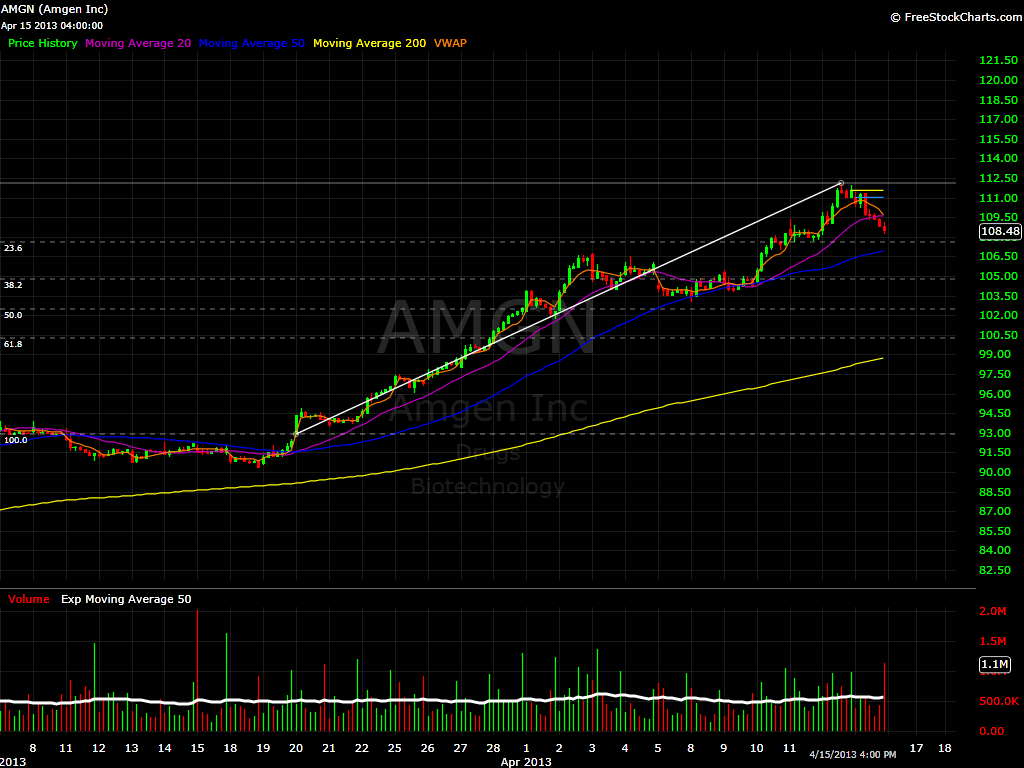
$AMGN Hourly Chart – Gaping up, this stock needs to run back and make new highs to get behind it. If at any time this name crosses under the 107.60 level, it will be a nice short.
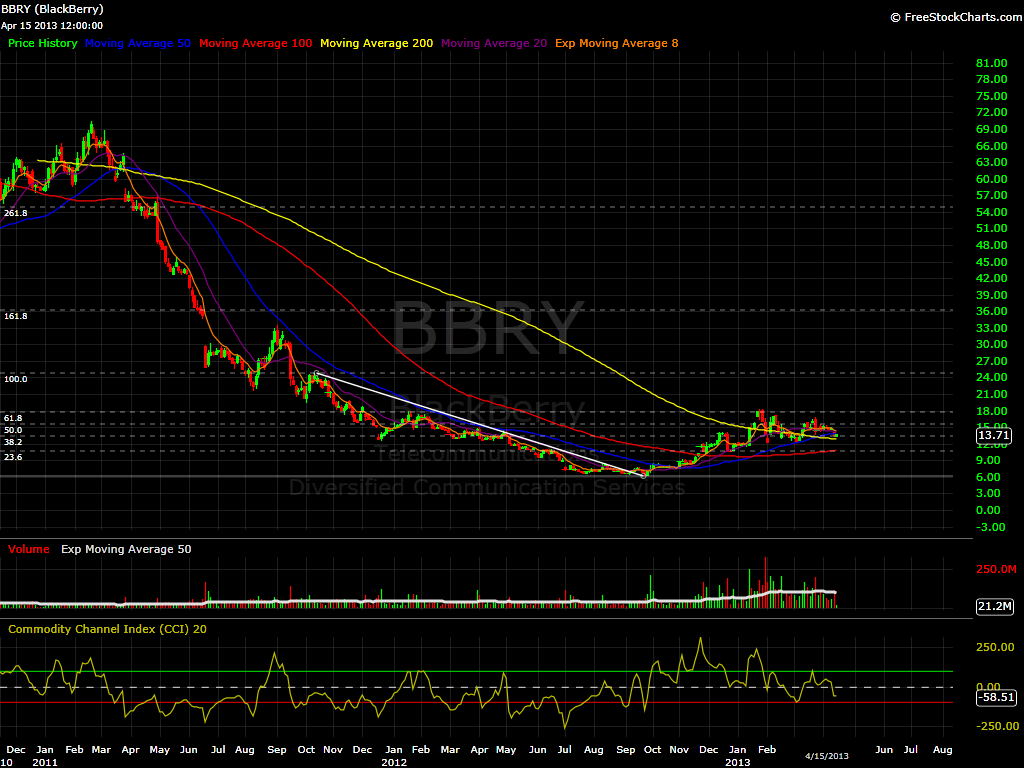
BBRY 2 Day Chart – Bounced off the 38.2% Fibonacci level 2 days ago, Looks like a good long contender. But only until it touches 15.52. This level have been a tough resistance to break.
$FSC 15 min Chart – Remember a 15 min chart or less is a scalp. So far it is gaping over 2 Fibonacci levels in pre-market. It needs to hold at least 10.42 (23.6% Fibonacci level). If it does, this will be a nice little long. Maybe short lived, but good for .50 cents.

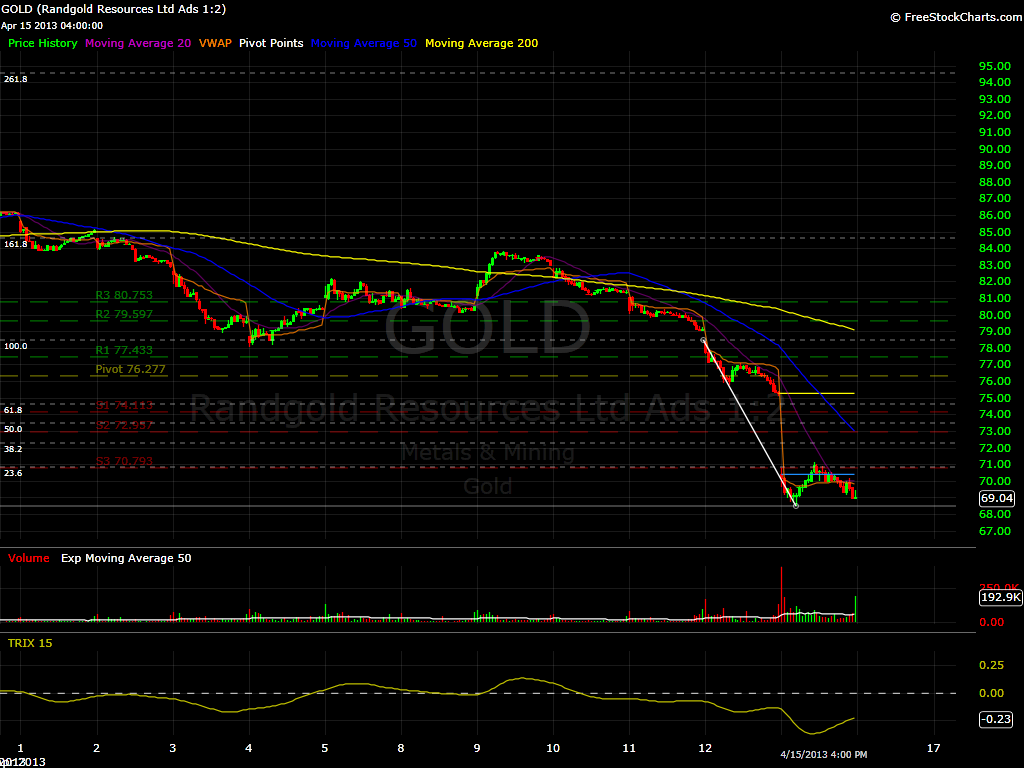
$GOLD 15 min chart – Another scalp name, gaping 2 Fibonacci levels in pre-market, I doubt that this one can hold any of them. Pre-market shows $GOLD @ 73.04. The current resistance is 73.48, and support is 72.30.
$SHPG 15 Min chart – Looking good if it can hold 89.50 (23.6% Fibonacci Level).

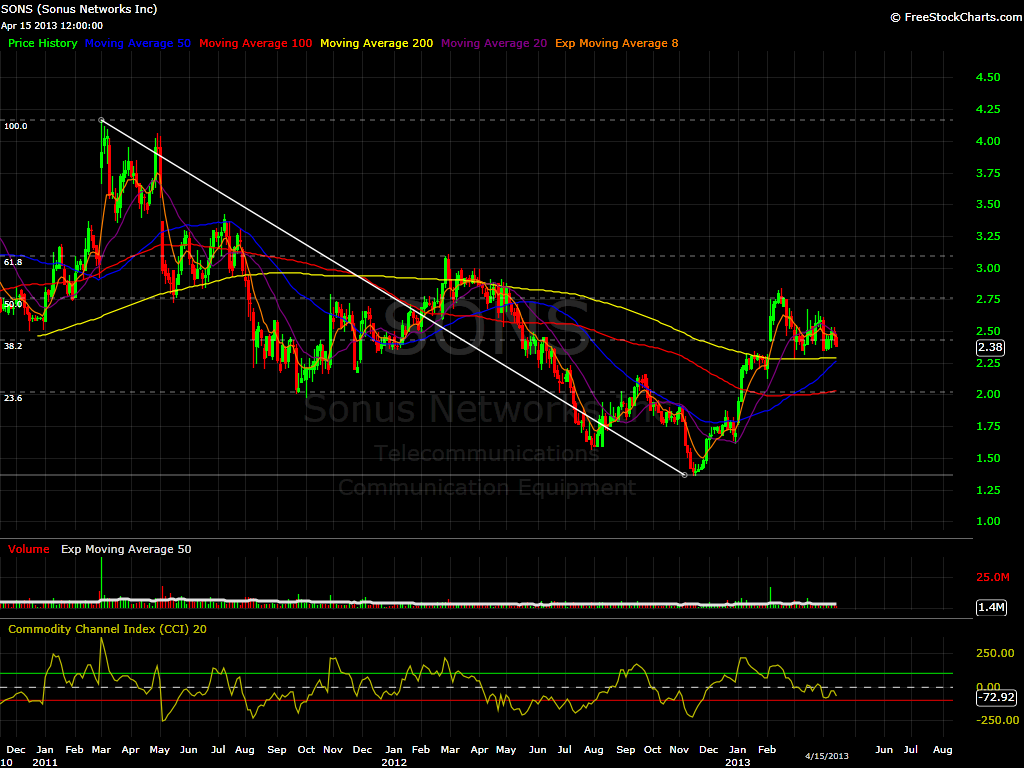
$SONS Daily Chart – I doubt that it holds 2.43 (38.2% Fibonacci Level) If you can find shares, this looks like a good short under that level.
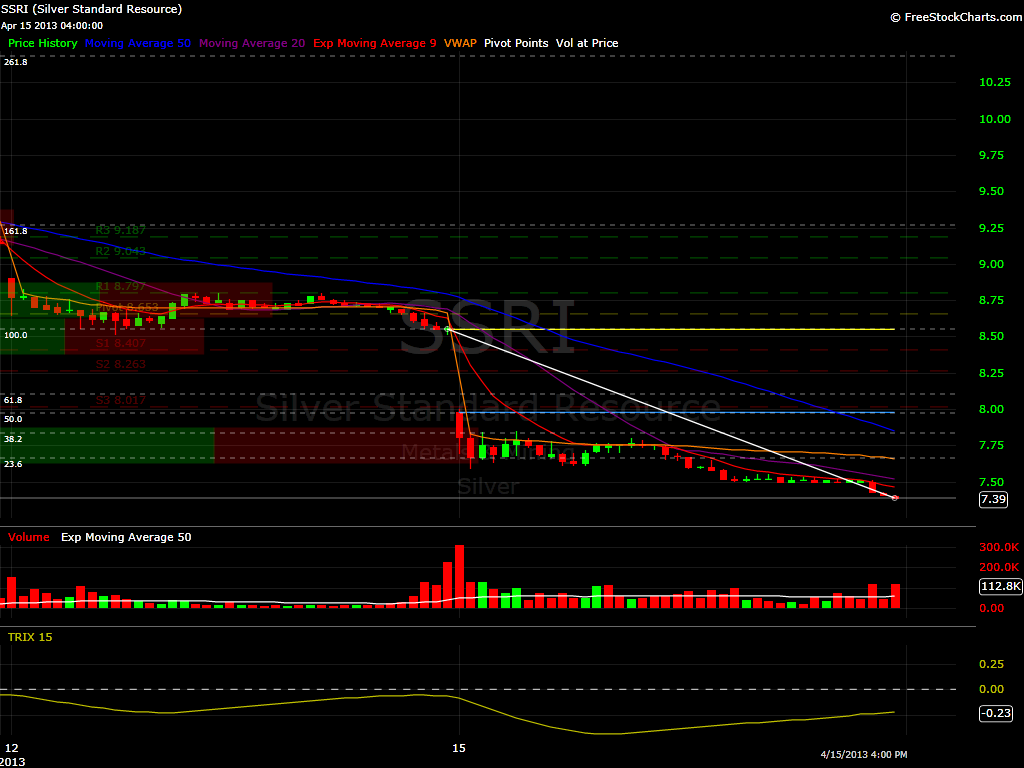
$SSRI 5 Min Chart – It better hold above 7.66, otherwise it will go fill that gap very fast.
$SVA Hourly Chart – The only name that held yestreday’s sell off. It is currently at 4.25 in pre-market. The support Fibonacci Level is 4.13. If that level holds, then it will be a nice long.

$ZNGA Daily Chart – Well, nothing to say, but wait for it to fill that gap, and hold 3.09. If it does, maybe I will get some long.


Welcome to Swing Trading the Stock Market Podcast!
I want you to become a better trader, and you know what? You absolutely can!
Commit these three rules to memory and to your trading:
#1: Manage the RISK ALWAYS!
#2: Keep the Losses Small
#3: Do #1 & #2 and the profits will take care of themselves.
That’s right, successful swing-trading is about managing the risk, and with Swing Trading the Stock Market podcast, I encourage you to email me (ryan@shareplanner.com) your questions, and there’s a good chance I’ll make a future podcast out of your stock market related question.
Passive investing can be a great source of funds for retirement and for building a nest egg. In this podcast episode, a husband and wife asks Ryan's thoughts on building a SPY position on just $2/day. While consistent building a nest egg, is great, the timing and strategy in doing so is just as important.
Be sure to check out my Swing-Trading offering through SharePlanner that goes hand-in-hand with my podcast, offering all of the research, charts and technical analysis on the stock market and individual stocks, not to mention my personal watch-lists, reviews and regular updates on the most popular stocks, including the all-important big tech stocks. Check it out now at: https://www.shareplanner.com/premium-plans
📈 START SWING-TRADING WITH ME! 📈
Click here to subscribe: https://shareplanner.com/tradingblock
— — — — — — — — —
💻 STOCK MARKET TRAINING COURSES 💻
Click here for all of my training courses: https://www.shareplanner.com/trading-academy
– The A-Z of the Self-Made Trader –https://www.shareplanner.com/the-a-z-of-the-self-made-trader
– The Winning Watch-List — https://www.shareplanner.com/winning-watchlist
– Patterns to Profits — https://www.shareplanner.com/patterns-to-profits
– Get 1-on-1 Coaching — https://www.shareplanner.com/coaching
— — — — — — — — —
❤️ SUBSCRIBE TO MY YOUTUBE CHANNEL 📺
Click here to subscribe: https://www.youtube.com/shareplanner?sub_confirmation=1
🎧 LISTEN TO MY PODCAST 🎵
Click here to listen to my podcast: https://open.spotify.com/show/5Nn7MhTB9HJSyQ0C6bMKXI
— — — — — — — — —
💰 FREE RESOURCES 💰
— — — — — — — — —
🛠 TOOLS OF THE TRADE 🛠
Software I use (TC2000): https://bit.ly/2HBdnBm
— — — — — — — — —
📱 FOLLOW SHAREPLANNER ON SOCIAL MEDIA 📱
*Disclaimer: Ryan Mallory is not a financial adviser and this podcast is for entertainment purposes only. Consult your financial adviser before making any decisions.
You Might Like

How to Trade Breakouts Without Getting Trapped

Managing Headline Risk: How to Survive the News Cycle Without Losing Your Mind

What to Do After a Winning Trade