
$ARNA Daily Chart – Not a bad setup, it does need to cross above the 8.23 which is the 50% Fibonacci level.

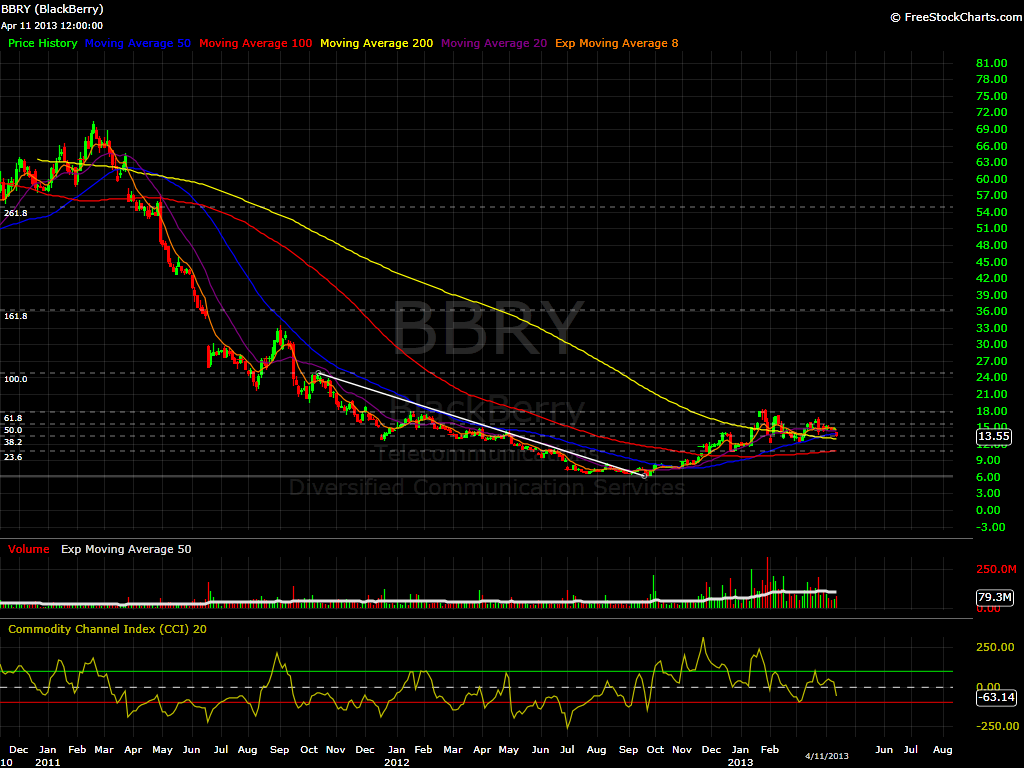
$BBRY 2 Day Chart – Wow sometimes I hate to be right. I got so much heat about 2 to 3 weeks ago when I started to short this stock after it did not break above 15.52 which represented the 50% Fibonacci level. Well yesterday it touched the lower level at 13.33 and bounced. Today is doing a small gap. That 13.33 needs to be defended in order for this stock to bounce. If it doesn’t, then the next target is 10.60 which represents two level. The 23.6% Fibonacci Level, and the 200ma.
$DRTX 15 Min Chart – This stock is desperatelly trying to make a come back. I drew the Fibonacci lines on a 15 min chart which represents a very short term trade. More like do or die. If this stock wants my atention it better cross 7.62 which is the 23.6% Fibonacci level also known as the launch pad.

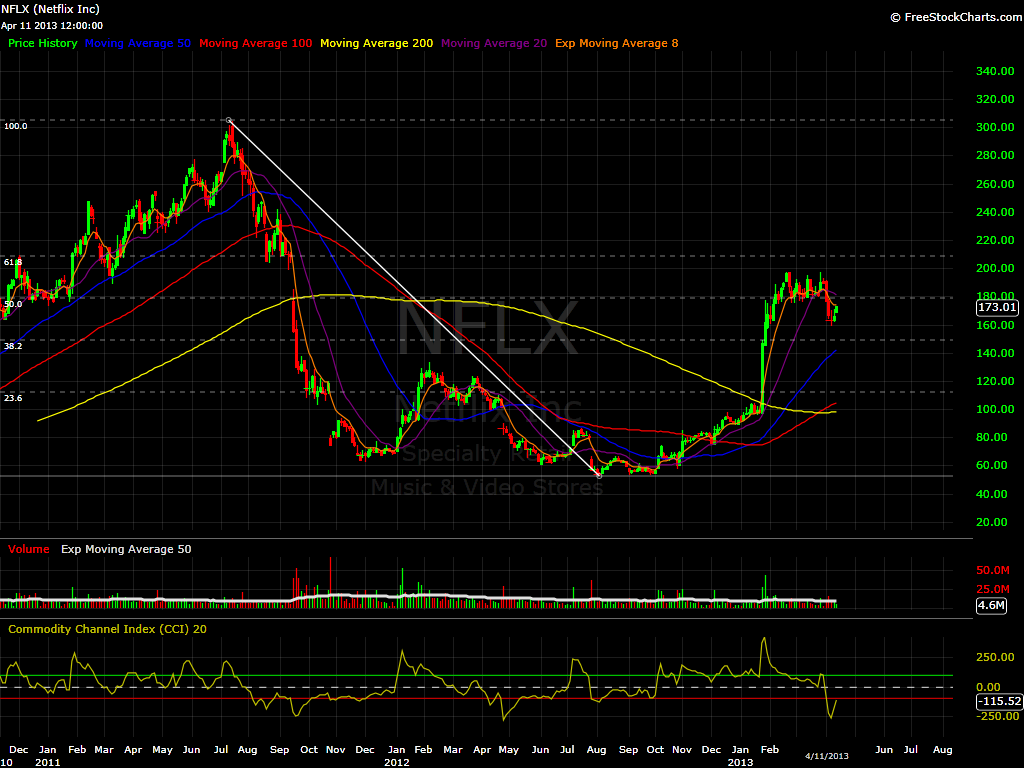
$NFLX 2 Day Chart – Looks like it wants to re-test the top Fibonacci level at 179.06. I would not chase it here, I would just wait to see if it can do it, if not, I would short it as it fails the 20ma and the 9ema on a 5 min chart.
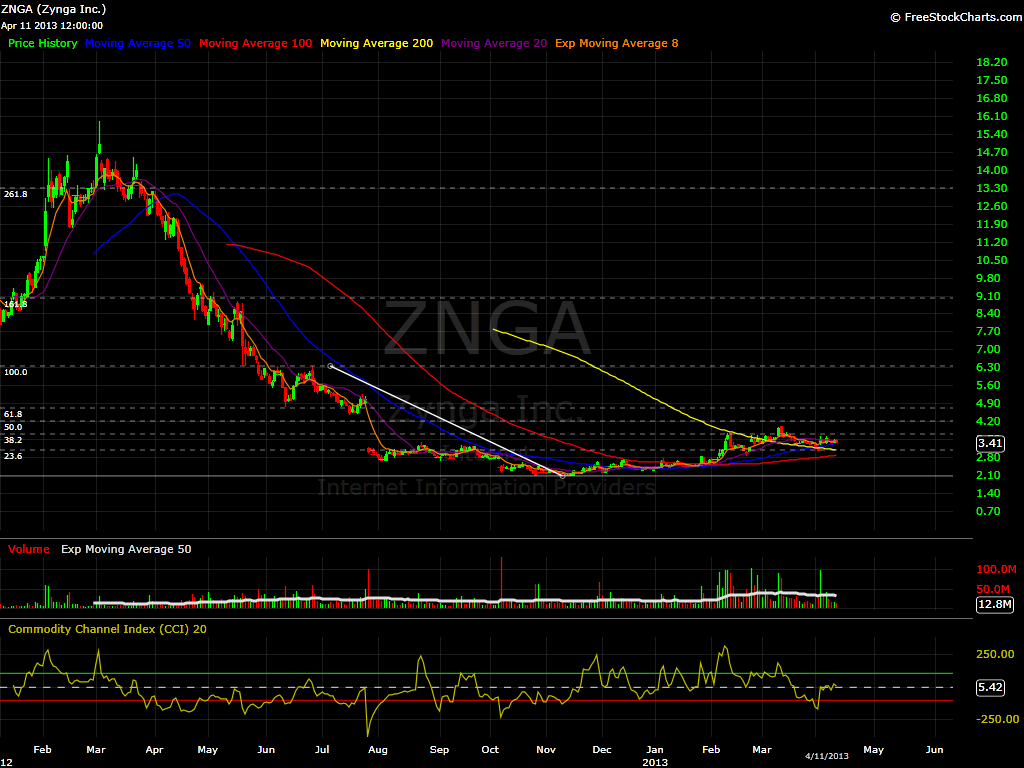
$ZNGA Daily Chart – The 20ma on a daily chart is the only thing holding this name. That is not enough for me. I think it dropsfill that ugly gap, and then we can seriously start talking about it.


Welcome to Swing Trading the Stock Market Podcast!
I want you to become a better trader, and you know what? You absolutely can!
Commit these three rules to memory and to your trading:
#1: Manage the RISK ALWAYS!
#2: Keep the Losses Small
#3: Do #1 & #2 and the profits will take care of themselves.
That’s right, successful swing-trading is about managing the risk, and with Swing Trading the Stock Market podcast, I encourage you to email me (ryan@shareplanner.com) your questions, and there’s a good chance I’ll make a future podcast out of your stock market related question.
In today's episode, I explain whether it is a good idea or not to rapidly increase the size of your portfolio if you come across a sum of cash. A lot of traders will do this without ever recognizing the emotional toll it can have on you as a swing trader and the awful mistakes you can make in doing so.
Be sure to check out my Swing-Trading offering through SharePlanner that goes hand-in-hand with my podcast, offering all of the research, charts and technical analysis on the stock market and individual stocks, not to mention my personal watch-lists, reviews and regular updates on the most popular stocks, including the all-important big tech stocks. Check it out now at: https://www.shareplanner.com/premium-plans
📈 START SWING-TRADING WITH ME! 📈
Click here to subscribe: https://shareplanner.com/tradingblock
— — — — — — — — —
💻 STOCK MARKET TRAINING COURSES 💻
Click here for all of my training courses: https://www.shareplanner.com/trading-academy
– The A-Z of the Self-Made Trader –https://www.shareplanner.com/the-a-z-of-the-self-made-trader
– The Winning Watch-List — https://www.shareplanner.com/winning-watchlist
– Patterns to Profits — https://www.shareplanner.com/patterns-to-profits
– Get 1-on-1 Coaching — https://www.shareplanner.com/coaching
— — — — — — — — —
❤️ SUBSCRIBE TO MY YOUTUBE CHANNEL 📺
Click here to subscribe: https://www.youtube.com/shareplanner?sub_confirmation=1
🎧 LISTEN TO MY PODCAST 🎵
Click here to listen to my podcast: https://open.spotify.com/show/5Nn7MhTB9HJSyQ0C6bMKXI
— — — — — — — — —
💰 FREE RESOURCES 💰
— — — — — — — — —
🛠 TOOLS OF THE TRADE 🛠
Software I use (TC2000): https://bit.ly/2HBdnBm
— — — — — — — — —
📱 FOLLOW SHAREPLANNER ON SOCIAL MEDIA 📱
*Disclaimer: Ryan Mallory is not a financial adviser and this podcast is for entertainment purposes only. Consult your financial adviser before making any decisions.
You Might Like

The Retail Trading Revolution: How Small Investors Are Reshaping the Stock Market

Fading the Gap: How Large Overnight Moves in SPY and QQQ Play Out During the Trading Day

How to Trade a Bear Flag