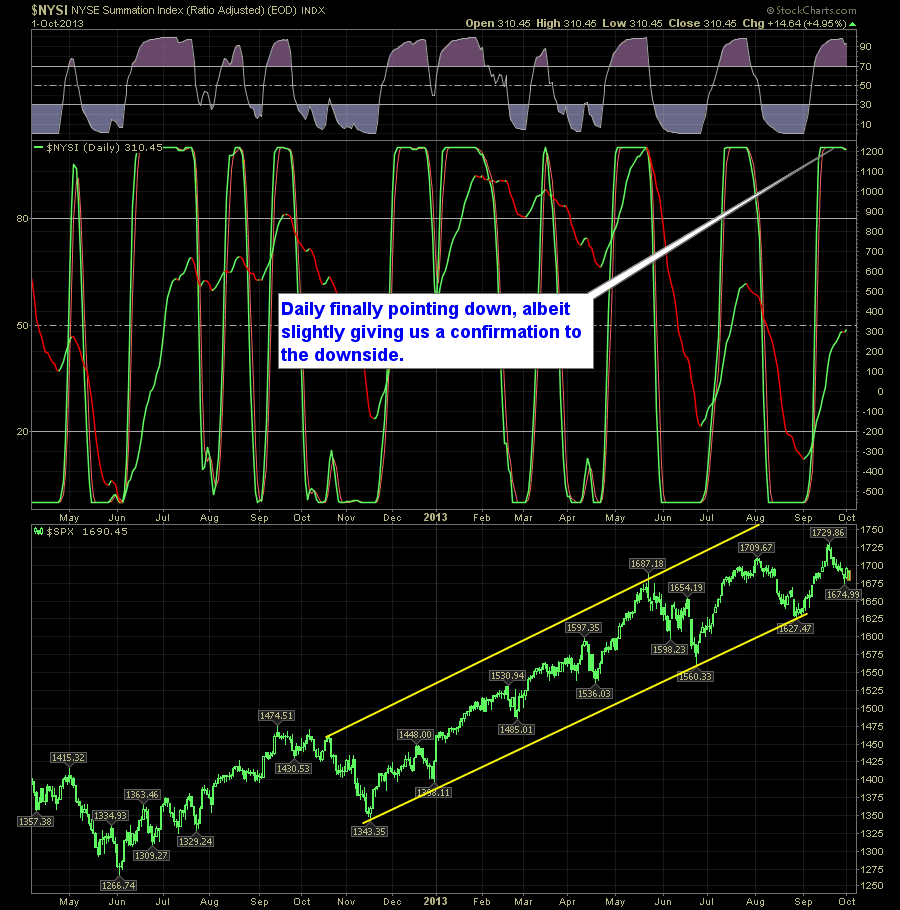
I’ve been talking about the looming bearish reversal signal likely to come on both the daily and weekly SharePlanner Reversal Indicator for a while now. Well, we got 1 out of 2 to confirm. Very rarely do they confirm at the extact same time. The daily shows us the short-term reversal to the downsdie.
A reader emailed me this chart and I found it quite interesting to say the least… SharePlanner Market Compass: Hey, if i say bounce enough, eventually I’ll be right….right? Quick Glance at the Market Heat Map and Industries Notables: No doubt the weakness was driven in from the financials and materials primarily. Apple for once
Think of this chart next time you hear an economist (ahem “Bernanke”) speaking… SharePlanner Market Compass: Today hardly qualifies as a bounce. Quick Glance at the Market Heat Map and Industries Notables: Goods and Services made a mild attempt at a bounce back. But it was utilities and banks and to a certain extent materials

Patience is key no matter what direction you plan on trading… SharePlanner Market Compass: Wait for it….Wait for it…. Quick Glance at the Market Heat Map and Industries Notables: It wasn’t the banks holding this market down today. Nor was it technology. Utilities and Healthcare was extremely bearish today. Goods and Services not too far

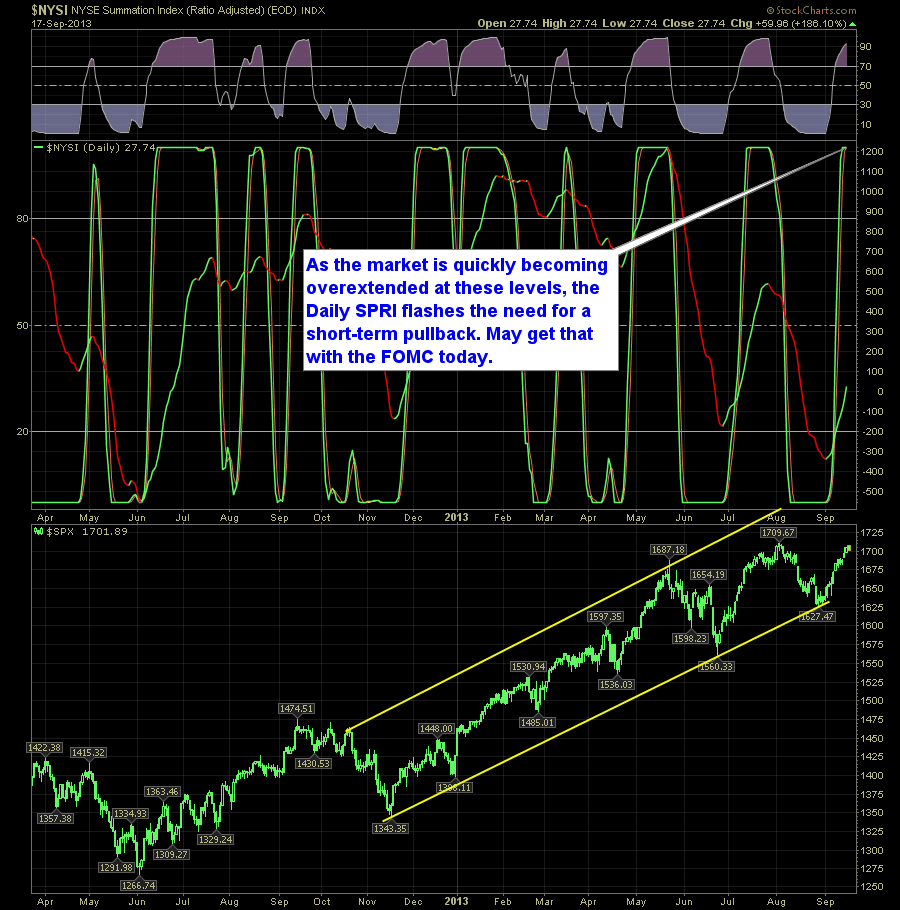
With price action lagging, Weekly closing in on overextension (which ultimately leads to a reversal signal) and now the Daily indicator at the top end of its range, something tells me we may see a quick bounce followed by more bearishness. Here’s the daily SPRI indicator:

5 Minute chart of SPX shows the potential for a bottom forming and a push higher coming… SharePlanner Market Compass: Stading buy this bounce rating for now. Quick Glance at the Market Heat Map and Industries Notables: Utilities still showed a minimal push higher to build on yesterday’s heavy gains. Financials still struggling quite a

Apple comes through again…of course when the market was selling-off again… SharePlanner Market Compass: Ok – got the pullback – now we are hitting some support levels that warrant a bounce. Quick Glance at the Market Heat Map and Industries Notables: “You know what would be crazy? If Apple was up 5% when the
FOMC Meetings at 52-week highs and the subsequent action… From Sentimentrader.com SharePlanner Market Compass: Alrighty – it’s about time the market decided to start agreeing with me 🙂 Quick Glance at the Market Heat Map and Industries Notables: Just when you thought utilities might be turning a corner….WRONG! Materials were just as bad. Banks held

It’s amazing what a little bit of TinkerBen’s Pixie Dust can do for stocks… Click here to see a larger picture SharePlanner Market Compass: So with the Fed pop today, my pullback call was a bit pre-mature, but I think it is still worth sticking with at this point. Quick Glance at the Market Heat Map
The SharePlanner is a tale of two time frames: First you have the daily which is screaming for a pullback, which is in conjunction with my own subjective SharePlanner Compass for the very, very near-term: But the Weekly shows a full-on bullish trend in the early-going:

spc@shareplanner.com
(904) 800-8420
© Copyright 2025 | SharePlanner Inc. All Rights Reserved.
Disclaimer: The information provided on this website is for educational and informational purposes only. Ryan Mallory and/or SharePlanner are not licensed financial advisors, brokers, or tax professionals. The content on this site should not be considered as financial, investment, tax, or legal advice.
All information and opinions expressed herein are based on sources believed to be accurate and reliable. However, we make no representation or warranty as to their accuracy, completeness, or reliability. Any action you take upon the information on this website is strictly at your own risk.
Past performance is not indicative of future results. Investing involves risk, including the possible loss of principal. All investors should make their own decisions based on their specific investment objectives and financial circumstances.
This site may contain links to external websites that are not provided or maintained by or in any way affiliated with Ryan Mallory and/or SharePlanner. Please note that Ryan Mallory and/or SharePlanner do not guarantee the accuracy, relevance, timeliness, or completeness of any information on these external websites.
By using this website, you agree that Ryan Mallory and/or SharePlanner and any affiliated parties are not responsible for any losses or damages resulting from your use of or reliance on the information provided.
It is strongly recommended that you consult with a qualified professional before making any financial decisions.