
I posted this chart on the SharePlanner Facebook Page this morning, but then felt like I needed to share it here on the home front (by the way – if you want additional unique content – LIKE our Facebook Page – it has information you won’t find anywhere else). But in essence, I took a
Chart showing support For/Against War in Syria Quick Glance at the Market Heat Map and Industries Notables: Dull market was an understatement today. Money is coming out of the utilities. Banks were respectable. Big names in consumer goods struggled. Be sure to check out my latest swing trades and overall past performance
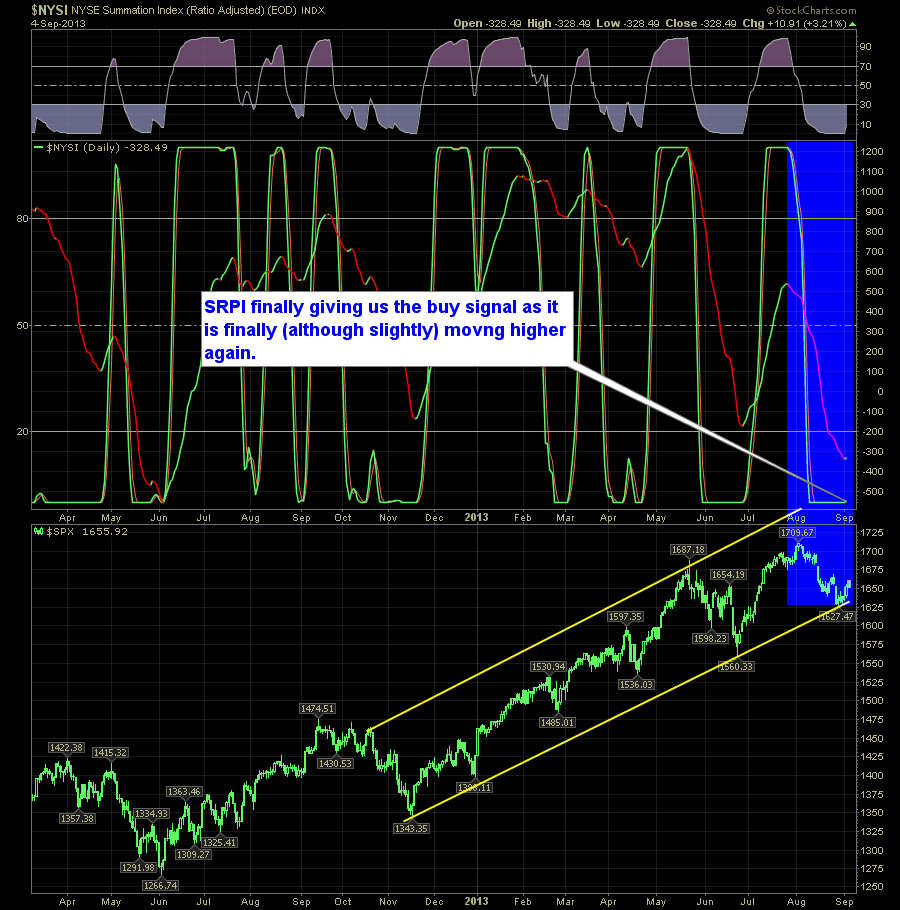
One of the beauties of the SharePlanner Reversal Indicator is that it helps me to stay in check. Though its not perfect by any means – it is darn near close and I’d be willing to pit it against anyone else’s trading tools. Here’s the daily SPRI showing that its getting its buy signal
Pullback to support leading to a similar bounce yet again? Quick Glance at the Market Heat Map and Industries Notables: Utilities were a drag on things. Banks largely sat out of today’s rally. Tech was a huge boost – unless you are Microsoft…Nokia – Why Nokia!?! Healthcare was stellar. Be sure to check out
Today’s Gap and Crap…
Nasty market these days wouldn't you say? Well that might all be coming to an end here as we are on the verge of getting a bullish reading in the next week or so on both the daily and weekly SPRI. The daily has been flat-lined for quite some time now, which indicates this is the
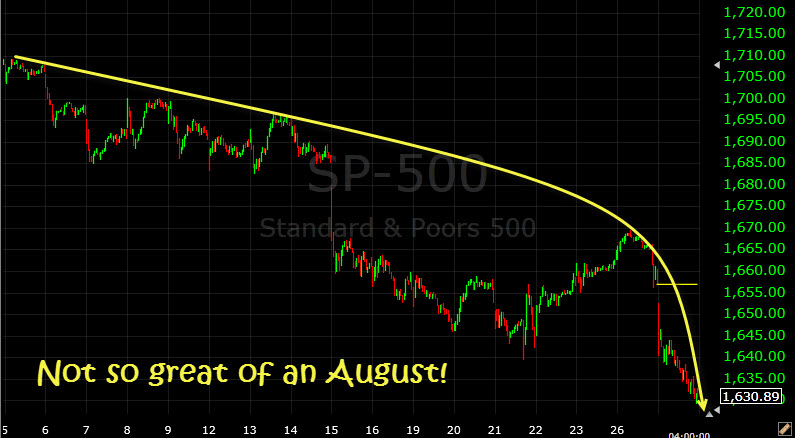
August has been a reality for this market Quick Glance at the Market Heat Map and Industries Notables: The first time in a long time that we’ve seen utilities act as a flight to safety amid a major sell-off in the broader market. Financials were actrocious for a second straight day. Oil survived due

John Kerry speaks and swats the market with his botox loaded chin… Quick Glance at the Market Heat Map and Industries Notables: Banks were an absolute train wreck today. Goods had some major weakness in it. Materials held on the most. Be sure to check out my latest swing trades and overall past performance

The T2108 – a chart that I publish rather infrequently, has caught my attention today because the one thing that I have noticed over the years since 2009 is that the volatility is dramatically falling off in this market. The wild swings are becoming less and less. Also during that same time the volume on
Fat Finger? Hacked? Tripped over a cord? Nasdaq screetches to a halt for 3 hours… Quick Glance at the Market Heat Map and Industries Notables: Nice pick up in momentum for the materials. Banks were solid! healthcare and services had limited issues. Be sure to check out my latest swing trades and overall past

spc@shareplanner.com
(904) 800-8420
© Copyright 2025 | SharePlanner Inc. All Rights Reserved.
Disclaimer: The information provided on this website is for educational and informational purposes only. Ryan Mallory and/or SharePlanner are not licensed financial advisors, brokers, or tax professionals. The content on this site should not be considered as financial, investment, tax, or legal advice.
All information and opinions expressed herein are based on sources believed to be accurate and reliable. However, we make no representation or warranty as to their accuracy, completeness, or reliability. Any action you take upon the information on this website is strictly at your own risk.
Past performance is not indicative of future results. Investing involves risk, including the possible loss of principal. All investors should make their own decisions based on their specific investment objectives and financial circumstances.
This site may contain links to external websites that are not provided or maintained by or in any way affiliated with Ryan Mallory and/or SharePlanner. Please note that Ryan Mallory and/or SharePlanner do not guarantee the accuracy, relevance, timeliness, or completeness of any information on these external websites.
By using this website, you agree that Ryan Mallory and/or SharePlanner and any affiliated parties are not responsible for any losses or damages resulting from your use of or reliance on the information provided.
It is strongly recommended that you consult with a qualified professional before making any financial decisions.