
A divergence is popping up on the charts that was the same as the one seen back in late January.
Of course that divergence ultimatley led to the massive -10% correction off of the all-time highs.
I follow the T2108 indicator provided by Worden, daily. It provides a reading on the percentage of stocks trading above their 40-day moving average. I have used it for over ten years now, and it is by far the best indicator for spotting potential tops, and identifying the bottoms in markets.
I saw the divergence happening in January and I didn’t pay much attention to it then, but now, it is doing the same thing again, but even more so. And that is, as the S&P 500 continues to climb higher, overall, the percentage of stocks trading above their 40-day moving average is actually dropping. That really isn’t a good sign.
As a result, I am being careful with how much long exposure I take on right now and waiting for index price action to confirm the divergence in the T2108 indicator, of a short-term top in this market to get short, or for stocks to trade in conjuction with the SPX better, in order to justify more long exposure.
So take a look at the indicator as it was in January, when the market was trading at their all-time highs and see the divergence:

Now notice the divergence, and how much bigger it is currently:
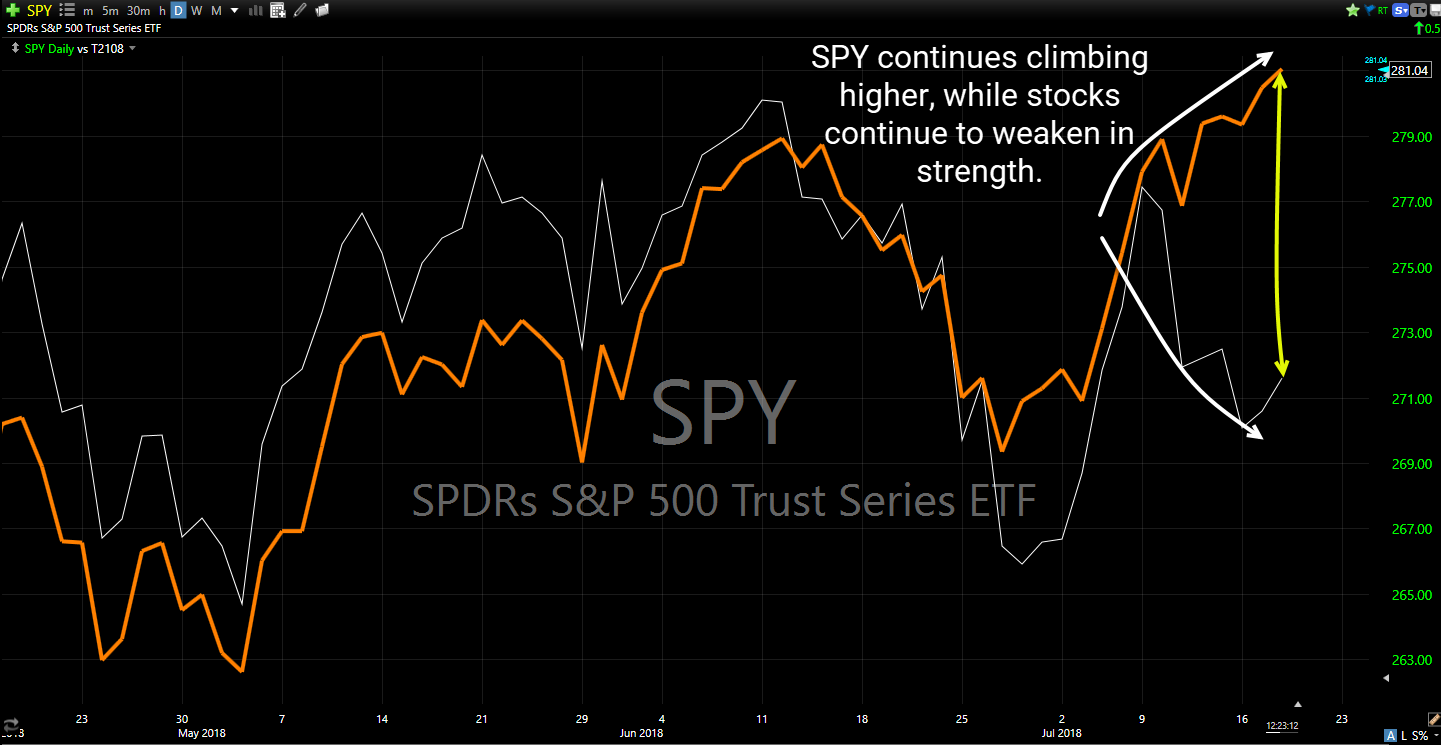
Now, should you get heavily short? NO! The market can remain irrational like this, far longer than you’d expect. As a result it is better to wait for the market to start the turn lower first, before you get net-short on this market.
That is what I will be doing.


Welcome to Swing Trading the Stock Market Podcast!
I want you to become a better trader, and you know what? You absolutely can!
Commit these three rules to memory and to your trading:
#1: Manage the RISK ALWAYS!
#2: Keep the Losses Small
#3: Do #1 & #2 and the profits will take care of themselves.
That’s right, successful swing-trading is about managing the risk, and with Swing Trading the Stock Market podcast, I encourage you to email me (ryan@shareplanner.com) your questions, and there’s a good chance I’ll make a future podcast out of your stock market related question.
Is it better to be lucky or skillful when it comes to being a good trader? I would argue you can have it both ways, but it requires that skill manages the luck, and at times when luck is simply against you too.
Be sure to check out my Swing-Trading offering through SharePlanner that goes hand-in-hand with my podcast, offering all of the research, charts and technical analysis on the stock market and individual stocks, not to mention my personal watch-lists, reviews and regular updates on the most popular stocks, including the all-important big tech stocks. Check it out now at: https://www.shareplanner.com/premium-plans
📈 START SWING-TRADING WITH ME! 📈
Click here to subscribe: https://shareplanner.com/tradingblock
— — — — — — — — —
💻 STOCK MARKET TRAINING COURSES 💻
Click here for all of my training courses: https://www.shareplanner.com/trading-academy
– The A-Z of the Self-Made Trader –https://www.shareplanner.com/the-a-z-of-the-self-made-trader
– The Winning Watch-List — https://www.shareplanner.com/winning-watchlist
– Patterns to Profits — https://www.shareplanner.com/patterns-to-profits
– Get 1-on-1 Coaching — https://www.shareplanner.com/coaching
— — — — — — — — —
❤️ SUBSCRIBE TO MY YOUTUBE CHANNEL 📺
Click here to subscribe: https://www.youtube.com/shareplanner?sub_confirmation=1
🎧 LISTEN TO MY PODCAST 🎵
Click here to listen to my podcast: https://open.spotify.com/show/5Nn7MhTB9HJSyQ0C6bMKXI
— — — — — — — — —
💰 FREE RESOURCES 💰
— — — — — — — — —
🛠 TOOLS OF THE TRADE 🛠
Software I use (TC2000): https://bit.ly/2HBdnBm
— — — — — — — — —
📱 FOLLOW SHAREPLANNER ON SOCIAL MEDIA 📱
*Disclaimer: Ryan Mallory is not a financial adviser and this podcast is for entertainment purposes only. Consult your financial adviser before making any decisions.
You Might Like
The Retail Trading Revolution: How Small Investors Are Reshaping the Stock Market

Fading the Gap: How Large Overnight Moves in SPY and QQQ Play Out During the Trading Day

How to Trade a Bear Flag