
I actually had a really fancy-shmancy market video planned for you all, but after having recorded it, and being so proud of it, I saw that my microphone had been on mute the entire time. Now usually I check for that kind of stuff before recording a 20-minute commentary, but apparently I have a bad

I really don’t like anything about the Caterpillar (CAT) chart whatsoever. If this stock breaks below $82, it is in for a world of hurting. It has one incredibly long-term head and shoulders patter, and all it needs to do is break below $82 and it’s showtime for the bears. Also check out the
Ah, Tesla. It’s up ~$10 a share today. In July I suggested that you should consider purchasing Tesla on the dip when the market reacted very badly to a Goldman Sachs downgrade on the stock. I bought some then, now I’m thinking of taking some profits. With a stock as hot as Tesla you never
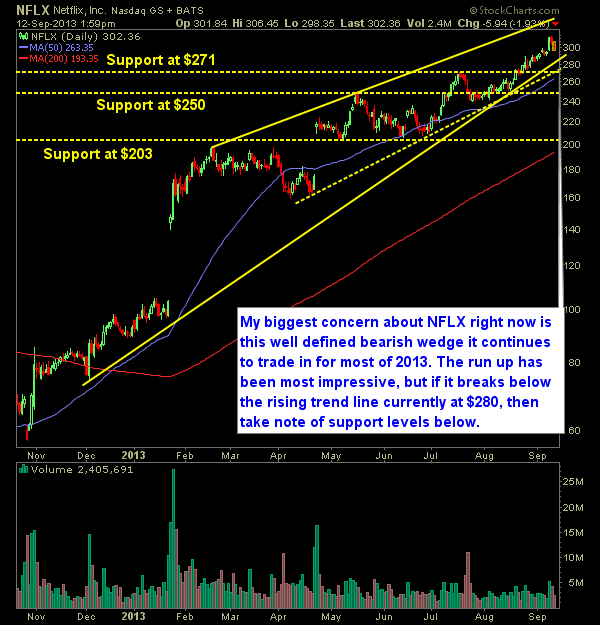
Netflix (NFLX) is by far one of the best stories of 2013. They are the dominant online streaming companies despite the fact their fundamentals are pretty wretched. Their climb back to $300 was fast but if you look at the chart you’ll notice that during that same time it has been forming for most
Is it just me, or are 99% of all the new features coming out on smart phones these days are things that are gimmicky and never to be used by the average user?
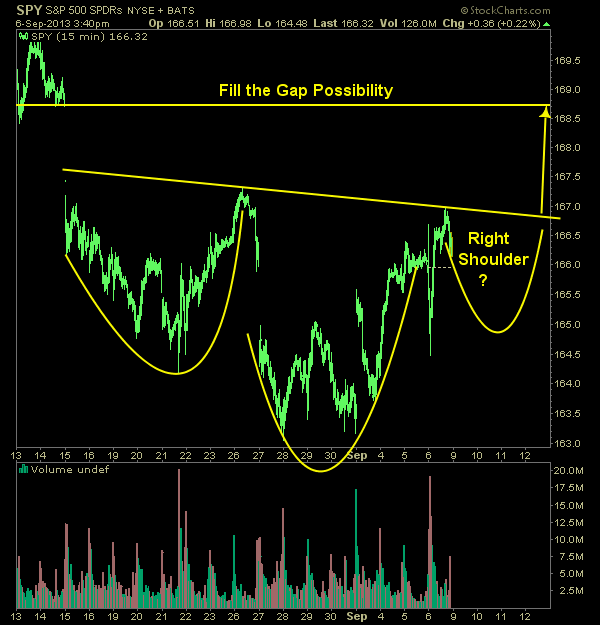
It is part of the reason why I am weary about getting heavily short for the week ahead…treading lightly here…. Source: SPY Posts
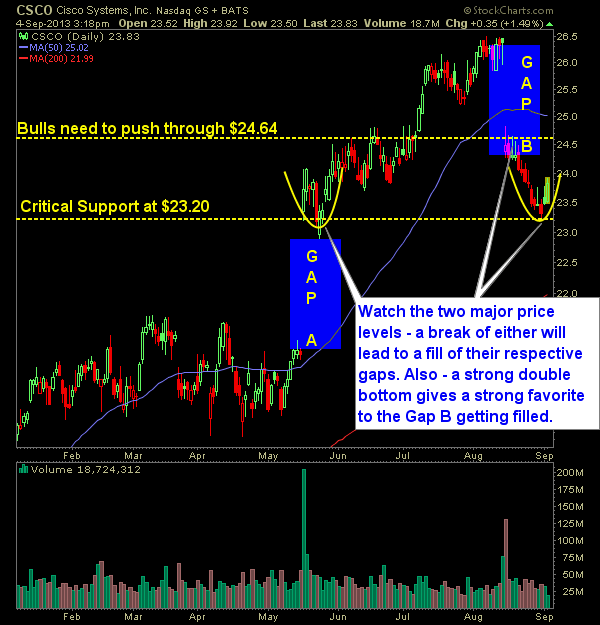
The Cisco (CSCO) chart is hard to get a good read. There is a lot of existing possibilties but the best way I could find to play it is to watch the two major price levels offering support/resistance and wait for them to break – at that point – you play the gap fills
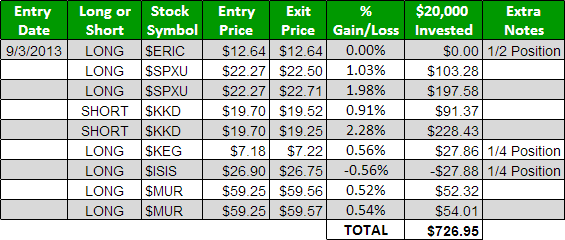
Oscar (@fuinhaz) was up to his old ways today and started September off with a bang!!! Solid gains with six trades netting over $720 in profits. Don’t wait any longer – sign up today for the SharePlanner Splash Zone with our free 7-day trial and start profiting off of my swing-trades and Oscar’s Day-Trades. Here’s today’s
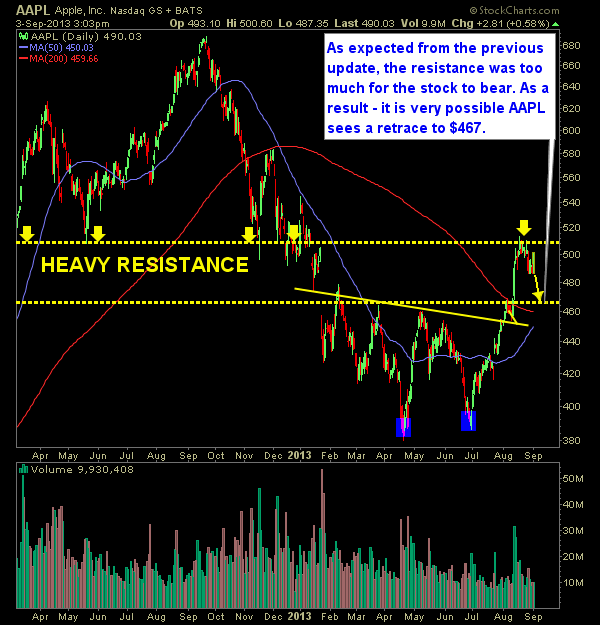
From the previous post I did on Apple’s technical analysis, I mentioned that the stock needed to come back down and wouldn’t be breaking through $510 anytime soon. That turned out to be true. At the moment, I think a likely pullback to somewhere around $467 seems to be in the cards. Take a

Lululemon has been a volatile beast of late, but in the midst of all that, there is a perfect triangle pattern forming, and once it can get above that $74 level than $75, a move into the $80’s should be all but certain. I’m not trading this one yet, but once it starts crossing certain

spc@shareplanner.com
(904) 800-8420
© Copyright 2025 | SharePlanner Inc. All Rights Reserved.
Disclaimer: The information provided on this website is for educational and informational purposes only. Ryan Mallory and/or SharePlanner are not licensed financial advisors, brokers, or tax professionals. The content on this site should not be considered as financial, investment, tax, or legal advice.
All information and opinions expressed herein are based on sources believed to be accurate and reliable. However, we make no representation or warranty as to their accuracy, completeness, or reliability. Any action you take upon the information on this website is strictly at your own risk.
Past performance is not indicative of future results. Investing involves risk, including the possible loss of principal. All investors should make their own decisions based on their specific investment objectives and financial circumstances.
This site may contain links to external websites that are not provided or maintained by or in any way affiliated with Ryan Mallory and/or SharePlanner. Please note that Ryan Mallory and/or SharePlanner do not guarantee the accuracy, relevance, timeliness, or completeness of any information on these external websites.
By using this website, you agree that Ryan Mallory and/or SharePlanner and any affiliated parties are not responsible for any losses or damages resulting from your use of or reliance on the information provided.
It is strongly recommended that you consult with a qualified professional before making any financial decisions.