
Technical Outlook: SPX almost had two days of consecutive selling. Instead in managed to rebound in afternoon trading and actually finish in the green. The last lat time the market saw two consecutive days of selling was on April 5th. SPX tested the 10-day moving average, held on, and rallied thereafter. QQQ, for the better
Learn to consistently profit in your trading by signing up for a Free 7-Day Trial to the SharePlanner Splash Zone! With your membership, you will get each and every trade that I make with real-time text and email alerts (international too) as well as access to my chat-room that I trade in each day. Click Here to

Technical Outlook: First legitimate sell-off on SPX yesterday since April 7th. SPX finished the day trading below the 5-day moving average. Watch the rising trend-line off of the February 11th lows. Currently the trend-line sits at 2087. A slew of earnings came out last night and this morning resulting in hard sell-offs in
Learn to consistently profit in your trading by signing up for a Free 7-Day Trial to the SharePlanner Splash Zone! With your membership, you will get each and every trade that I make with real-time text and email alerts (international too) as well as access to my chat-room that I trade in each day. Click Here to

Technical Outlook: SPX steadily increased in value all day yesterday, with hardly a sign of selling until the final hour of trading when it gave up nearly all of its gains on the day. This creates a very concerning doji candle on the SPY right at the upper Bollinger Band extreme. It is very
Learn to consistently profit in your trading by signing up for a Free 7-Day Trial to the SharePlanner Splash Zone! With your membership, you will get each and every trade that I make with real-time text and email alerts (international too) as well as access to my chat-room that I trade in each day. Click Here to

Technical Outlook: Doji candle pattern yesterday, with today creating the potential for an evening star pattern should the market sell-off. With that said, there has been an impeccable resilience to price action of late, where every gap down or sign of weakness is immediately bought up by market participants. VIX is at a key
Learn to consistently profit in your trading by signing up for a Free 7-Day Trial to the SharePlanner Splash Zone! With your membership, you will get each and every trade that I make with real-time text and email alerts (international too) as well as access to my chat-room that I trade in each day. Click Here to
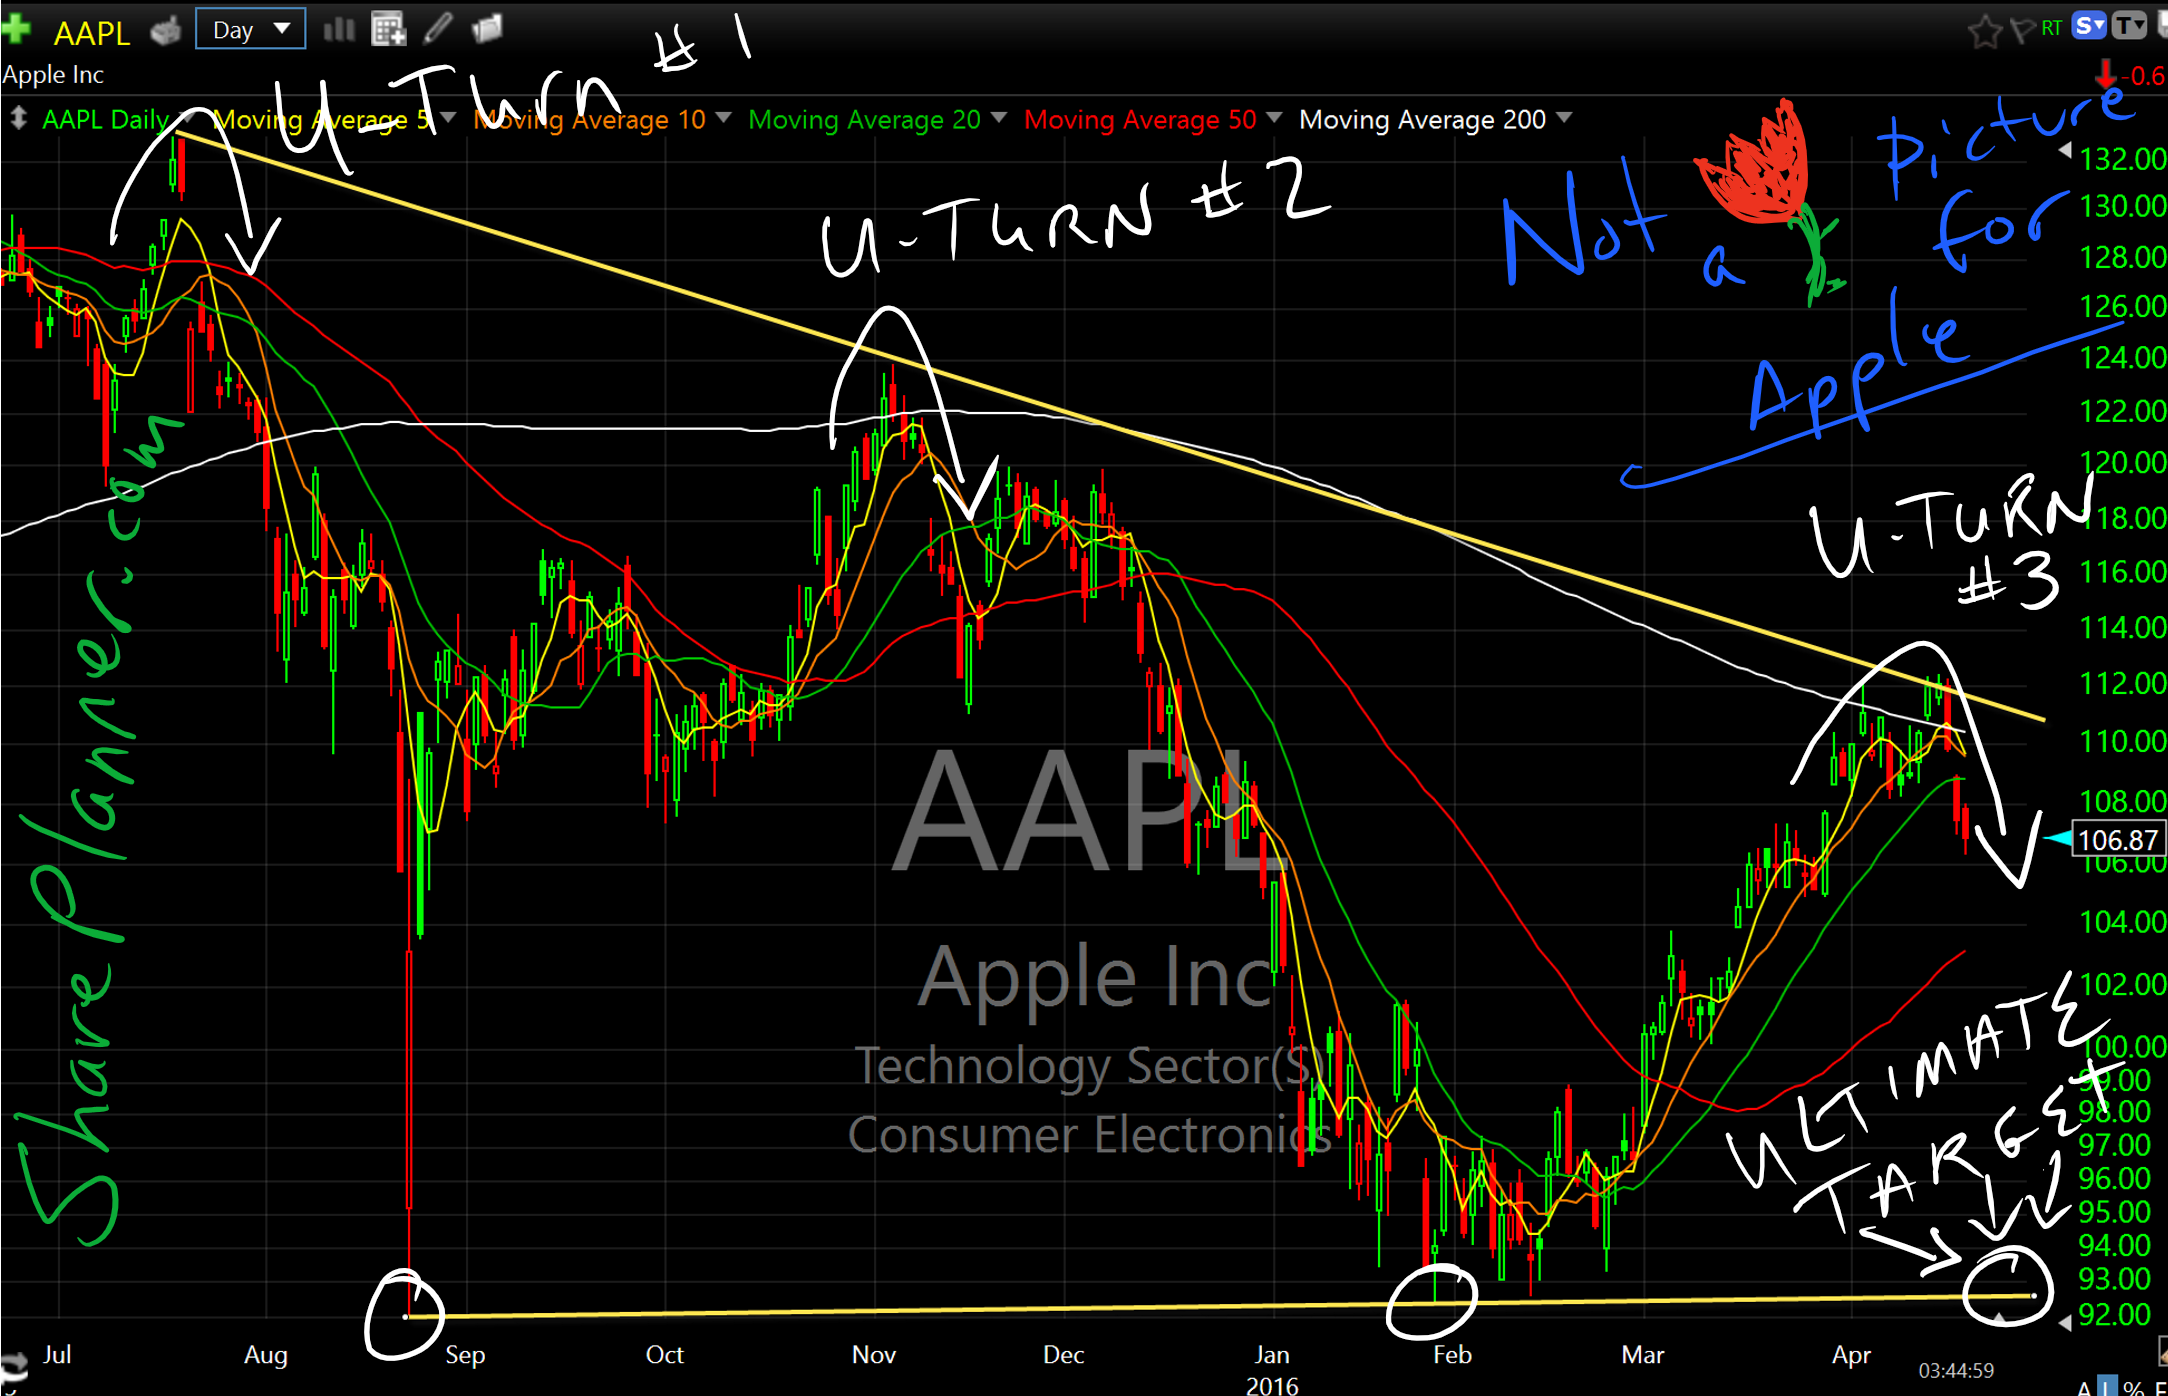
There are two major trends in the Apple (AAPL) chart and none of them help their cause at all. Overhead you have a declining level of resistance that continues to reject price hard,and underneath price you have an area that price continues to be drawn to following the aforementioned rejection pattern. See for yourself…
Just think… just a little over two months ago, SPX was down almost 12% year-to-date with what appeared to be no end in sight. Since then, the market has been on an unabated rally that has erased all of those losses that the market was experiencing.

spc@shareplanner.com
(904) 800-8420
© Copyright 2025 | SharePlanner Inc. All Rights Reserved.
Disclaimer: The information provided on this website is for educational and informational purposes only. Ryan Mallory and/or SharePlanner are not licensed financial advisors, brokers, or tax professionals. The content on this site should not be considered as financial, investment, tax, or legal advice.
All information and opinions expressed herein are based on sources believed to be accurate and reliable. However, we make no representation or warranty as to their accuracy, completeness, or reliability. Any action you take upon the information on this website is strictly at your own risk.
Past performance is not indicative of future results. Investing involves risk, including the possible loss of principal. All investors should make their own decisions based on their specific investment objectives and financial circumstances.
This site may contain links to external websites that are not provided or maintained by or in any way affiliated with Ryan Mallory and/or SharePlanner. Please note that Ryan Mallory and/or SharePlanner do not guarantee the accuracy, relevance, timeliness, or completeness of any information on these external websites.
By using this website, you agree that Ryan Mallory and/or SharePlanner and any affiliated parties are not responsible for any losses or damages resulting from your use of or reliance on the information provided.
It is strongly recommended that you consult with a qualified professional before making any financial decisions.