
My stock market trading plan today Bears had the opportunity to really drive this market lower. It was right in their hands. The result? Same as 99% of the other instances. They get the charts to line up for them, make the market look top heavy and ready to rollover and then they disappear. The

My stock market trading plan today Another dose of “Buy the Dip”. At one point it was down as much as 18 points. I kid not, but once the afternoon rolled around, that 18 points shrank to just under 4 points by the close of business. In the meantime, that kind of price action leaves

April Stock Market If you believe in old stock market cliches, then you’ll know that April represents, in theory, the last good month of trading for the bulls before they “Sell in May and Go Away!”. But lets face, it, yes, the volume in the summer is lower, and sell-offs tend to happen more often
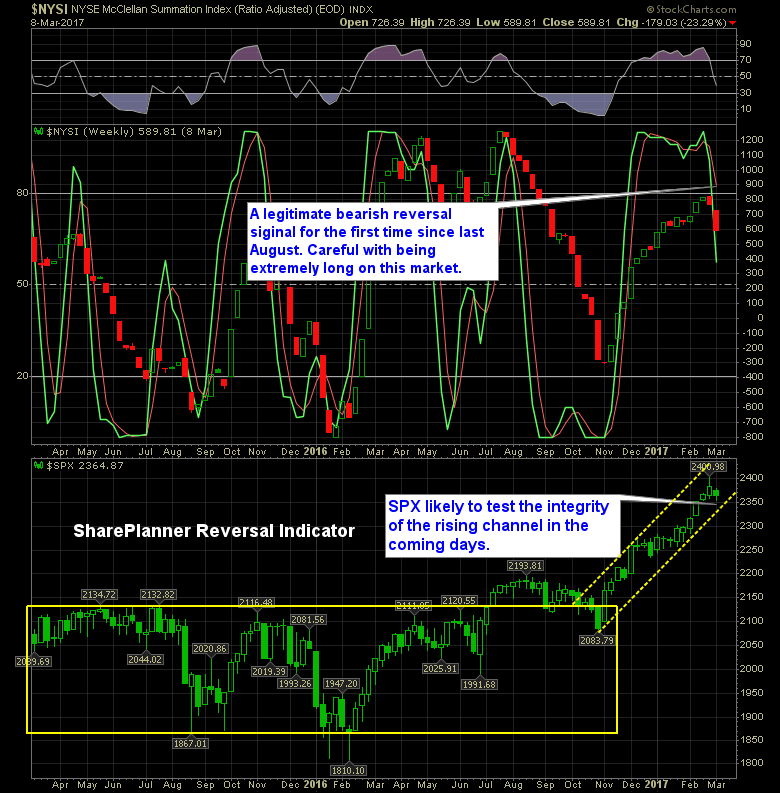
The SharePlanner Trend Reversal Indicator is flashing all sorts of bearishess And it is worth noting that there hasn't been a bearish reversal signal on the indicator since August of last year, which led to a 100-point reversal in the markets over the course a three month period. Obviously that came to an end when

Technical Analysis: The S&P 500 (SPX) took a breather yesterday when it decided to sell-off ever so slightly. The 5-day, 10-day and 20-day moving averages on SPX are converging and offered an excellent support level for the bulls to bounce off of yesterday. Watch that level of support, again today. Light Sweet Crude Oil Futures

Technical Analysis: Volatile trading session to start the year with the initial gap up being all but squandered before the end of day rally restored much of the day’s morning gains. This was the first time S&P 500 (SPX) has traded higher during the “Santa Rally”. Today will be the last day of this rally –

Technical Analysis: A dour way to end 2016 on a 3-day losing streak for the S&P 500 (SPX). The last three times, the month of January has finished lower. It has yet to do so four straight months. But as we have seen plenty of times before, the market has no problem doing something for

Technical Analysis: A sell-off yesterday that was hardly a sell-off for the S&P 500 (SPX). Price fell by 0.66 points or 0.03%. Essentially it was a day of sideways price action. SPX found support right at the 20-day moving average yesterday by forming an indecisive doji candle just above it. Volume fell off some yesterday

Technical Analysis: The S&P 500 (SPX) jump started the Santa Rally with a hard sell-off yesterday that sent equities reeling nearly 1% and to the lower end of the short-term trading range. Price broke the 5-day and 10-day moving averages and threatens to test the 20-day moving average today. This is the strongest sell-off seen since

Technical Analysis: Yesterday marked the twelfth consecutive day in which S&P 500 (SPX) was stuck in a sideways trading range of 29 points. Today is the beginning of the 5-day trading even traditionally known as the Santa Rally, which encompasses the last three trading sessions of the year and first two trading sessions of the new year.

spc@shareplanner.com
(904) 800-8420
© Copyright 2025 | SharePlanner Inc. All Rights Reserved.
Disclaimer: The information provided on this website is for educational and informational purposes only. Ryan Mallory and/or SharePlanner are not licensed financial advisors, brokers, or tax professionals. The content on this site should not be considered as financial, investment, tax, or legal advice.
All information and opinions expressed herein are based on sources believed to be accurate and reliable. However, we make no representation or warranty as to their accuracy, completeness, or reliability. Any action you take upon the information on this website is strictly at your own risk.
Past performance is not indicative of future results. Investing involves risk, including the possible loss of principal. All investors should make their own decisions based on their specific investment objectives and financial circumstances.
This site may contain links to external websites that are not provided or maintained by or in any way affiliated with Ryan Mallory and/or SharePlanner. Please note that Ryan Mallory and/or SharePlanner do not guarantee the accuracy, relevance, timeliness, or completeness of any information on these external websites.
By using this website, you agree that Ryan Mallory and/or SharePlanner and any affiliated parties are not responsible for any losses or damages resulting from your use of or reliance on the information provided.
It is strongly recommended that you consult with a qualified professional before making any financial decisions.