
Technical Analysis: Yesterday was peculiar in the price action that unfolded on the S&P 500 (SPX) where price greatly retracted at the close of the day and gave up most of the day’s gains. This is indicating to me that market strength is being used to book recent profits. Should this happen again today, and more

Technical Analysis: Price action yesterday on S&P 500 (SPX) broke below the previous day’s trading action for the first time since 11/4 when the market capped off a 9-day losing streak. Also of note, for the first time since the Monday before the election, SPX dropped below, and closed below its 5-day moving average. Russell 2000 (

Technical Analysis: Two major milestones achieved yesterday, with the Dow Jones Industrial Average (DJIA) reaching 19,000 and S&P 500 (SPX) passing 2,200 for the first time. The market has continued along the lines of Thanksgiving being a reliable ‘bullish’ week for the market. The Wednesday before Thanksgiving has a history of being reliably and consistently bullish as well. Since

Technical Analysis: Big day for S&P 500 (SPX) as price broke out of its 3-day doji-range and pushed to the upside. SPDRs S&P 500 (SPY) saw its volume drop for a fourth consecutive day and fall below recent averages. The 5-day moving average continues to hold strong for SPY as it has tested and bounced each

This chart speaks for itself in that the rally that we have seen in oil for the entire month of August may be quickly coming to an end if this move off of the August lows is part of a larger head and shoulders. The only way to dispell this theory is by break the

There is a very nice retest taking place on USO and its rising trend-line off of the February lows. We’ve seen oil in the past, crush through many technical barriers to the downside, and I’m not even sure I want to play this bounce at this moment, but the temptation is definitely there.
The look and feel to oil is starting to become problematic. Listen, I won’t touch this thing as a short setup. I just won’t. I’ve tried a few times a long the way, when things started to get queasy with the rally, and each time, the outcome wasn’t so hot.

Is it a top in oil? Maybe. Maybe not. What I do know is that USO (United States Oil Fund for those wondering) is having a horrible time trying to push through the 200-day moving average. If you look, at the weekly chart, this commodity has surged higher and since the February bottoms, and hardly
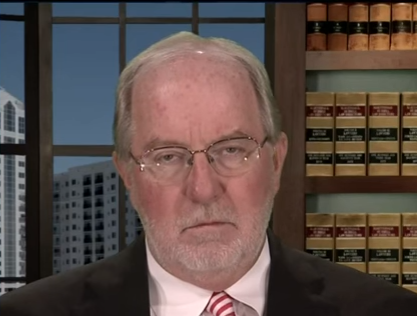
For those wondering when they should be taking profits on their oil trades, never fear, Dennis Gartman just went bullish on crude. For those who are not aware, this is the individual who has a track record of being the most perfect contrarian indicator that our generation has ever seen. Yes, Jim Cramer was

It just amazes me that there hasn’t been any demands for an investigation into this sell-off today, and with 23 minutes left of trading, I may be even speaking to soon to assume that we’ll even close in the red today. Knowing recent history, the algos may very well decide to ramp it up in

spc@shareplanner.com
(904) 800-8420
© Copyright 2025 | SharePlanner Inc. All Rights Reserved.
Disclaimer: The information provided on this website is for educational and informational purposes only. Ryan Mallory and/or SharePlanner are not licensed financial advisors, brokers, or tax professionals. The content on this site should not be considered as financial, investment, tax, or legal advice.
All information and opinions expressed herein are based on sources believed to be accurate and reliable. However, we make no representation or warranty as to their accuracy, completeness, or reliability. Any action you take upon the information on this website is strictly at your own risk.
Past performance is not indicative of future results. Investing involves risk, including the possible loss of principal. All investors should make their own decisions based on their specific investment objectives and financial circumstances.
This site may contain links to external websites that are not provided or maintained by or in any way affiliated with Ryan Mallory and/or SharePlanner. Please note that Ryan Mallory and/or SharePlanner do not guarantee the accuracy, relevance, timeliness, or completeness of any information on these external websites.
By using this website, you agree that Ryan Mallory and/or SharePlanner and any affiliated parties are not responsible for any losses or damages resulting from your use of or reliance on the information provided.
It is strongly recommended that you consult with a qualified professional before making any financial decisions.