
Let’s take a look at the weekly chart of oil and what it means moving forward. And lets just say shorting it at this point is a high risk trade simply because it has broken through one resistance level and is challenging another right now that, once broken leaves plenty of upside for the commodity

Alright folks – I have been following $USO and the price of crude very closely of late. I’m of the belief that crude is ready to drop – another 5-6% this week, and in the process, allow for those who took the short set up at recent highs, a great return for the risk. I’m
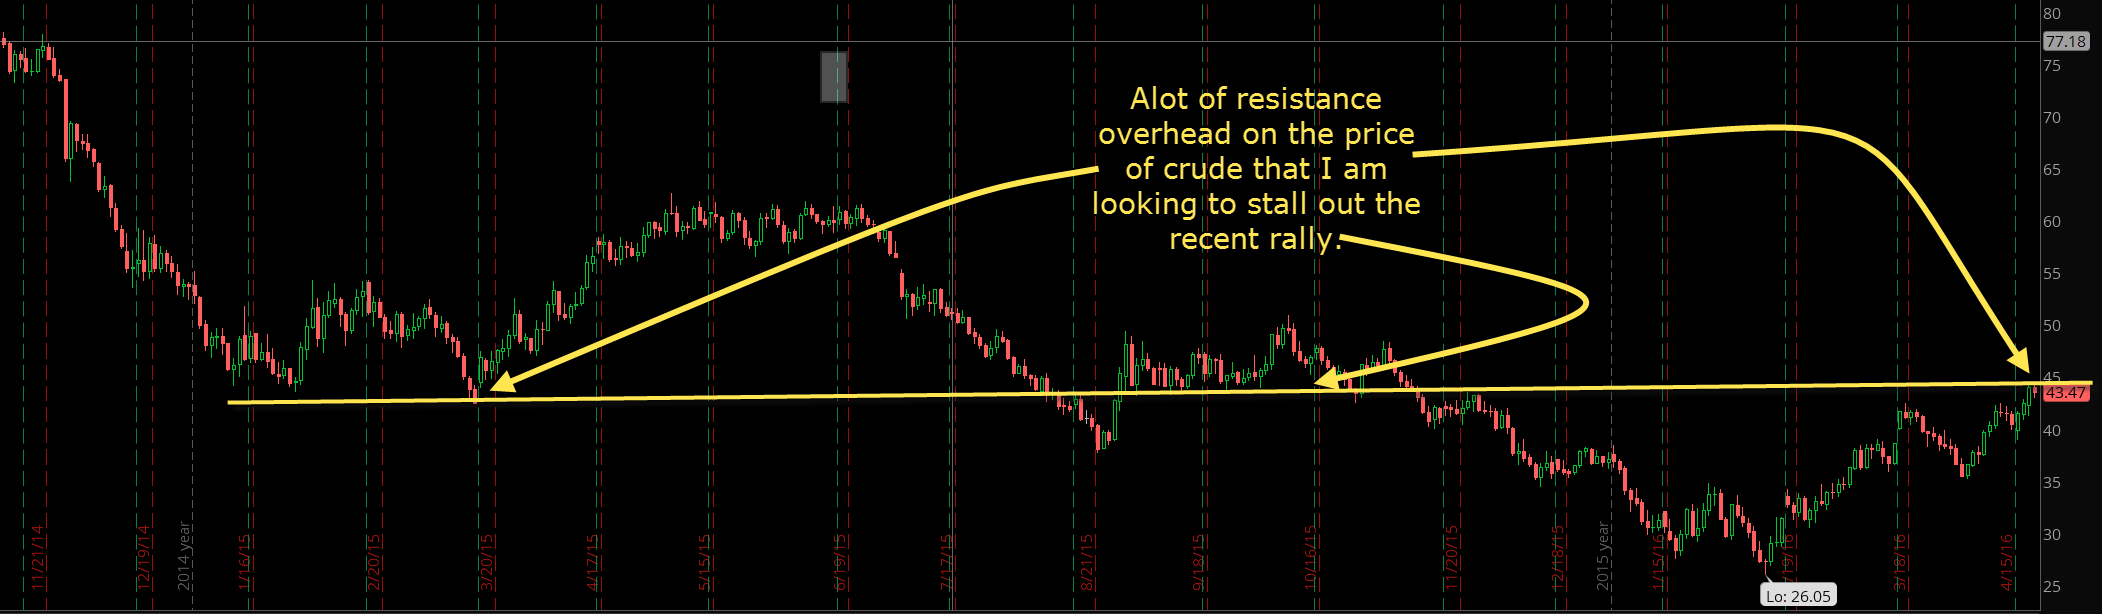
4/21: Crude hitting major resistance on the chart. Since I don't trade futures in the Splash Zone, I have elected to short USO instead. There is plenty of long-term resistance overhead on the price of crude, which I will provide a chart for.

Technical Outlook: Two straight days of consolidation at the rally highs. Weakness this morning across the board in the indices as a result of a failure for oil producing countries to agree upon a freeze in production. As a result, USO is looking at a potential double top in the short-term as it starts to

USO chart so far is really interesting to me. Yes, it has lost all of its short-term moving averages that include the 5-day, 10-day and 20-day, but overall, the pullback that has, until today, lasted six straight days and seven of the last eight days, has only given up 38.2% of its recent gains,
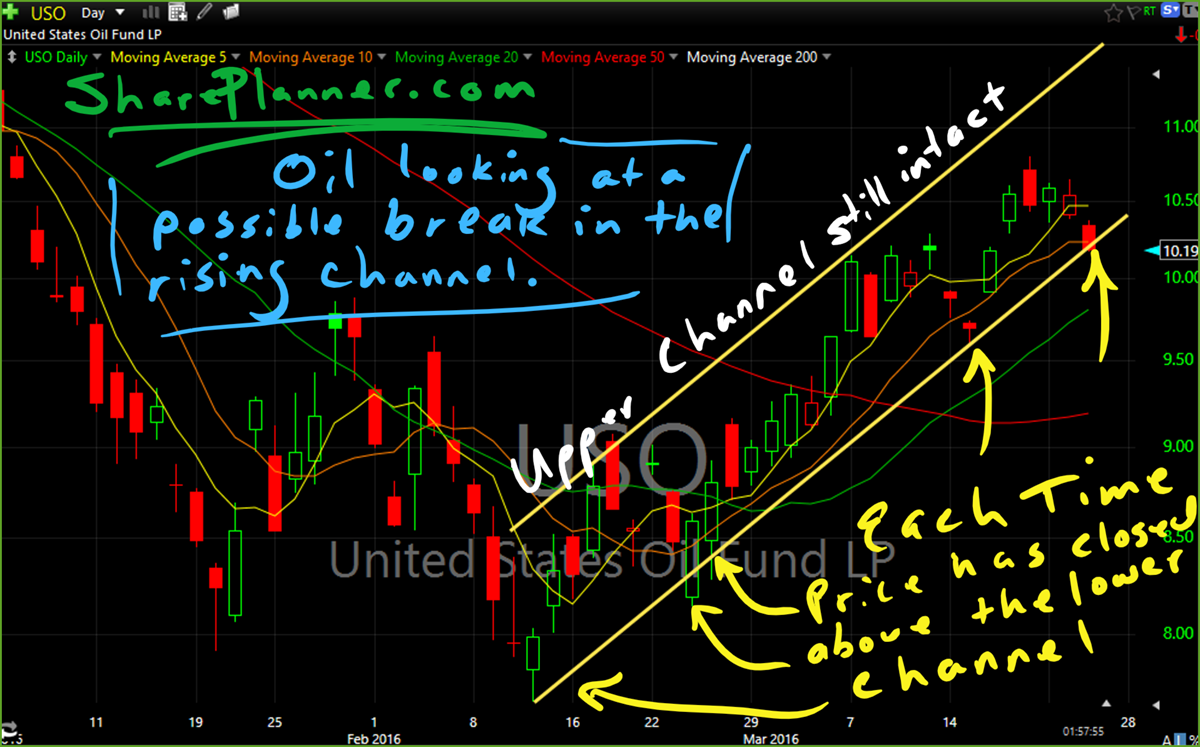
After breaking out of its recent base, oil has been on a roll, breaking out of its rising channel and crushing the hopes and dreams of bears wanting to see $20 oil. Now the question is, does the bears have a renewed sense of hope here with a possible break in the rising trend-line? We

Check out the chart below to see what I am watching on the USO play. Some good developments unfolding for the bulls, but still remains on shaky ground until it can prove itself. Here’s the technical analysis on USO:

spc@shareplanner.com
(904) 800-8420
© Copyright 2025 | SharePlanner Inc. All Rights Reserved.
Disclaimer: The information provided on this website is for educational and informational purposes only. Ryan Mallory and/or SharePlanner are not licensed financial advisors, brokers, or tax professionals. The content on this site should not be considered as financial, investment, tax, or legal advice.
All information and opinions expressed herein are based on sources believed to be accurate and reliable. However, we make no representation or warranty as to their accuracy, completeness, or reliability. Any action you take upon the information on this website is strictly at your own risk.
Past performance is not indicative of future results. Investing involves risk, including the possible loss of principal. All investors should make their own decisions based on their specific investment objectives and financial circumstances.
This site may contain links to external websites that are not provided or maintained by or in any way affiliated with Ryan Mallory and/or SharePlanner. Please note that Ryan Mallory and/or SharePlanner do not guarantee the accuracy, relevance, timeliness, or completeness of any information on these external websites.
By using this website, you agree that Ryan Mallory and/or SharePlanner and any affiliated parties are not responsible for any losses or damages resulting from your use of or reliance on the information provided.
It is strongly recommended that you consult with a qualified professional before making any financial decisions.