
The market acts like it isn’t sure what to do with itself. The market rallied off the lows this morning immediately following the market’s open, but since then it has given back those gains and momentum and now is just floundering around. Up? Down? Who freakin’ knows. Buyers and sellers aren’t overly inspired except for

Technical Outlook: Yesterday SPX showed strong potential leading up to the FOMC statement to break out of its four day price range and push and continue its dead cat bounce. But once the FOMC statement came out, SPX saw a 44 point reversal from the highs of the day. Volume saw a slight
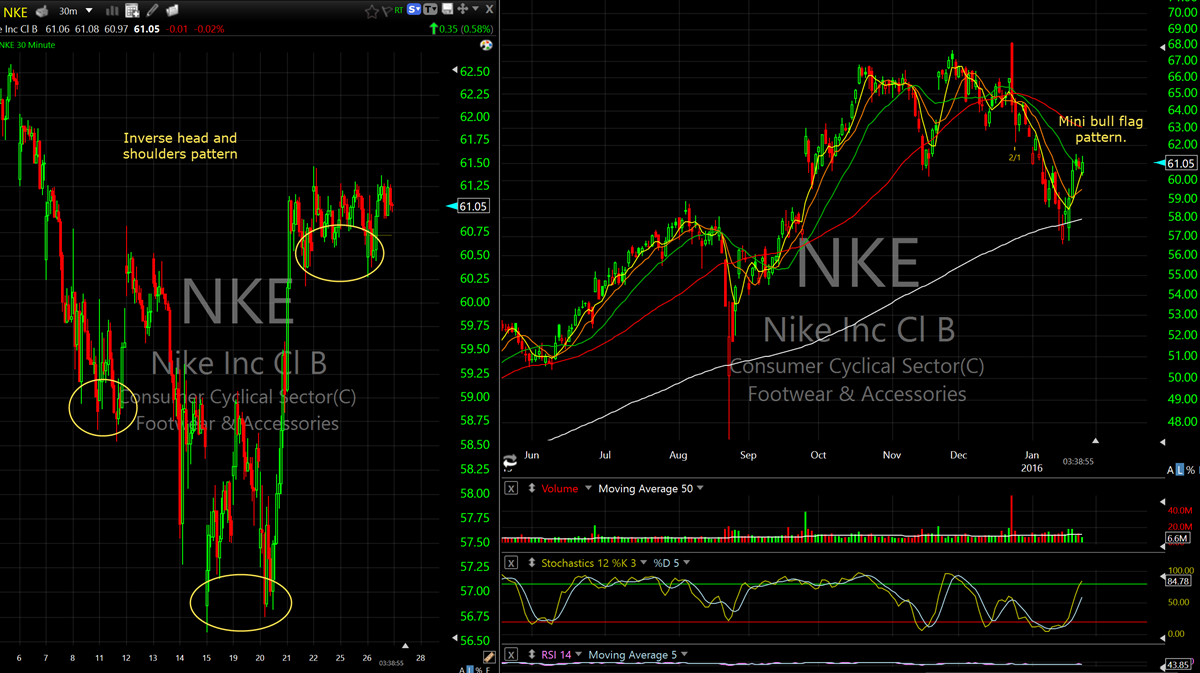
Here are today's swing-trades in NKE and GOOGL Nike (NKE) 1/26: Massive head and shoulders pattern on $NKE on the 30 minute chart, that can also bee seen during the month of January on the daily chart. Looking for a move back up to $65 from here. Risk can be dramatically tightened as the trade

Technical Outlook: SPX rallied a solid 2% yesterday further the dead cat bounce gains and recapturing the 5 and 10-day moving averages. Volume on SPY dropped for a second straight day and just a little bit above average. No overly impressive in that regard. When considering the price action from Friday, it

2015 was gone at the strike of midnight and with its farewell comes 2016. For almost every trader out there, that is great news. It is the hope of all traders that the potential for profitability in 2016 is much more attainable. In this past year stocks were down, bonds were down, commodities crashed, hedge
-
2015 was gone at the strike of midnight and with its farewell comes 2016. For almost every trader out there, that is great news. It is the hope of all traders that the potential for profitability in 2016 is much more attainable. In this past year stocks were down, bonds were down, commodities crashed, hedge

Technical Outlook: SPX provided strong follow through yesterday, bouncing back and reclaiming the 5 and 10-day moving averages. A test of 2076, the peak of the lower-high that was previously established could be challenged with a massive move today, but a more likely scenario would be 2061 that represents the convergence of the 50
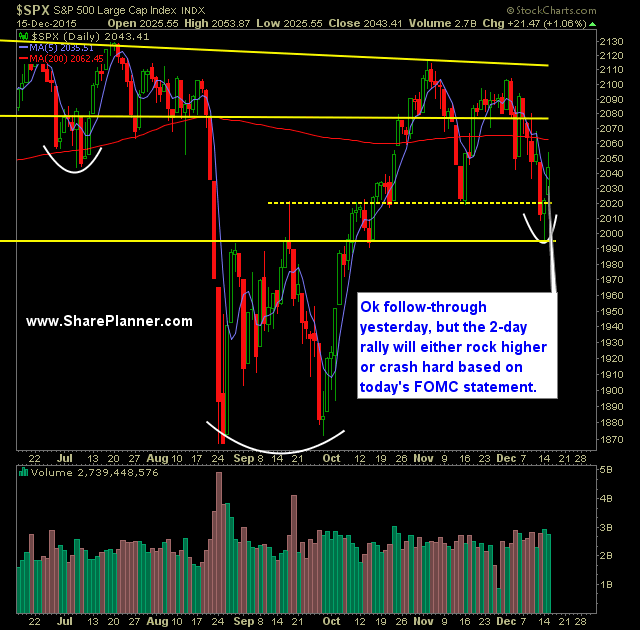
Technical Outlook: Respectable follow through yesterday, though SPY failed to do much of anything after the first 30 minutes of trading, finishing just barely higher than where it started the day at. Today is the day where the FOMC is expected to begin increasing interest rates – with today starting at a quarter point

It’s still never too late to finish the year off right – and you can do so by signing up for the SharePlanner Splash Zone and with your membership, you will get each and every trade that I make with real-time text and email alerts (international too) as well as access to my chat-room that I trade
I just finished up another profitable month in November! It’s still never too late to finish the year off right – and you can do so by signing up for the SharePlanner Splash Zone and with your membership, you will get each and every trade that I make with real-time text and email alerts (international too) as

spc@shareplanner.com
(904) 800-8420
© Copyright 2025 | SharePlanner Inc. All Rights Reserved.
Disclaimer: The information provided on this website is for educational and informational purposes only. Ryan Mallory and/or SharePlanner are not licensed financial advisors, brokers, or tax professionals. The content on this site should not be considered as financial, investment, tax, or legal advice.
All information and opinions expressed herein are based on sources believed to be accurate and reliable. However, we make no representation or warranty as to their accuracy, completeness, or reliability. Any action you take upon the information on this website is strictly at your own risk.
Past performance is not indicative of future results. Investing involves risk, including the possible loss of principal. All investors should make their own decisions based on their specific investment objectives and financial circumstances.
This site may contain links to external websites that are not provided or maintained by or in any way affiliated with Ryan Mallory and/or SharePlanner. Please note that Ryan Mallory and/or SharePlanner do not guarantee the accuracy, relevance, timeliness, or completeness of any information on these external websites.
By using this website, you agree that Ryan Mallory and/or SharePlanner and any affiliated parties are not responsible for any losses or damages resulting from your use of or reliance on the information provided.
It is strongly recommended that you consult with a qualified professional before making any financial decisions.