
Technical Outlook:
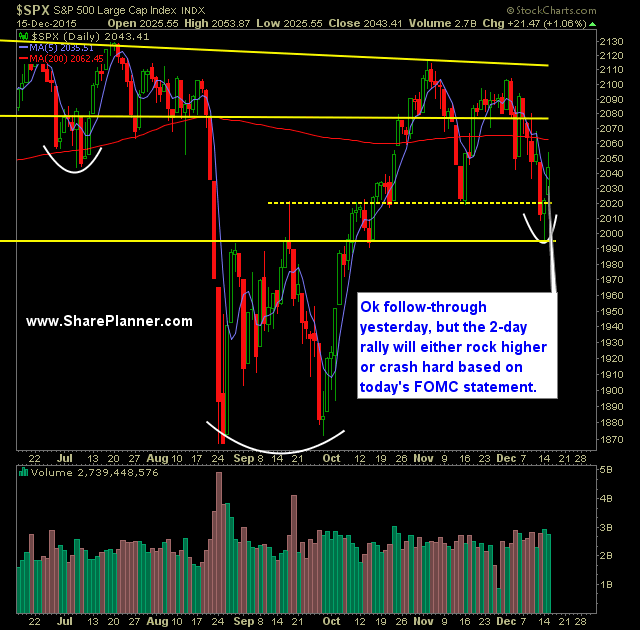
- Respectable follow through yesterday, though SPY failed to do much of anything after the first 30 minutes of trading, finishing just barely higher than where it started the day at.
- Today is the day where the FOMC is expected to begin increasing interest rates – with today starting at a quarter point rate hike.
- The hike has been known for weeks now, so the mystery should be taken out of the question. The remaining variable is what else is said in the FOMC statement beyond just the rate increase.
- The market has undergone a “sell the rumor” effect ahead of the FOMC meeting for the past two weeks. It’ll be interesting to see whether the reaction to the reality of the rate hike is a “buy the news” move.
- I wouldn’t be surprised either, quite frankly, if the market provided more of a muted reaction to the FOMC statement as well. Some of the most anticipated statements of the last 18 months has been met with rather underwhelming price movements thereafter.
- Market is showing a good deal of strength ahead of today’s open, though, often times it is quite common for the market to trade in a tight range ahead of the Fed.
- VIX dropped 7.8% yesterday down to 20.95 – which is still an above average reading for the VIX.
- T2108 (% of stocks trading above the 40-day moving average) rallied 35 points to 21%. Still a very oversold reading. Also formed a bullish morning star pattern.
- Tight consolidated pattern on the SPX 30 minute chart… almost like a bull flag pattern actually.
- Much of yesterday’s rally centered around oil, financials and biotech. The large majority of technology stocks sat out the rally, including FB, GOOGL, NFLX, AMZN and most notably AAPL which was down 1.7%. If this rally is to continue, these stocks will need to be apart of it.
- Island reversal pattern has formed on the daily SPY all the way down to the 1 minute chart. This is a very bullish pattern for the market and could very well mark the bottom to the recent selling.
- Volume on SPY has weakened for a second straight day, but still well above average levels.
- Bulls must continue to defend the lows established yesterday, to avoid reinvigorating the bears to begin shorting the market again.
- Breaking back above 2019 and reclaiming the 5-day moving average for SPX was a great start to this possible end-of-year rally.
- S&P 500 has followed a similar path to that of 2014, in fact it is eerily similar with both sell-offs being within 3 points of each other in terms of sell-off depth.
- 2014 ripped higher following this sell-off for the remainder of the year.
- Also an interesting analog for 2015 has been its similarity to 2011 price action.
- For twelve years straight, the market over the course of the last 30 trading days of the calendar year, has yielded a net positive gain, and thus reinforcing the concept of the “Santa Rally”.
My Trades:
- Closed out FB yesterday at $104.58 for a 0.6% gain.
- Added two new long positions yesterday.
- I will consider adding 1-2 new positions today if the market can avoid another sell-off and hold the pre-market strength being seen here.
- 60% Long / 40% Cash
- Remain long: MSFT at $54.81 and five other positions.
- Join me each day for all my real-time trades and alerts in the SharePlanner Splash Zone
Chart for SPX:


Welcome to Swing Trading the Stock Market Podcast!
I want you to become a better trader, and you know what? You absolutely can!
Commit these three rules to memory and to your trading:
#1: Manage the RISK ALWAYS!
#2: Keep the Losses Small
#3: Do #1 & #2 and the profits will take care of themselves.
That’s right, successful swing-trading is about managing the risk, and with Swing Trading the Stock Market podcast, I encourage you to email me (ryan@shareplanner.com) your questions, and there’s a good chance I’ll make a future podcast out of your stock market related question.
Refusing to take a loss when the trade has turned, and the reason for getting into the trade in the first place is no longer valid, is one of the biggest problems traders face. In this video, Ryan Mallory discusses the pitfalls that comes with refusing to take the loss and instead opting to become a bagholder on one's trades.
Be sure to check out my Swing-Trading offering through SharePlanner that goes hand-in-hand with my podcast, offering all of the research, charts and technical analysis on the stock market and individual stocks, not to mention my personal watch-lists, reviews and regular updates on the most popular stocks, including the all-important big tech stocks. Check it out now at: https://www.shareplanner.com/premium-plans
📈 START SWING-TRADING WITH ME! 📈
Click here to subscribe: https://shareplanner.com/tradingblock
— — — — — — — — —
💻 STOCK MARKET TRAINING COURSES 💻
Click here for all of my training courses: https://www.shareplanner.com/trading-academy
– The A-Z of the Self-Made Trader –https://www.shareplanner.com/the-a-z-of-the-self-made-trader
– The Winning Watch-List — https://www.shareplanner.com/winning-watchlist
– Patterns to Profits — https://www.shareplanner.com/patterns-to-profits
– Get 1-on-1 Coaching — https://www.shareplanner.com/coaching
— — — — — — — — —
❤️ SUBSCRIBE TO MY YOUTUBE CHANNEL 📺
Click here to subscribe: https://www.youtube.com/shareplanner?sub_confirmation=1
🎧 LISTEN TO MY PODCAST 🎵
Click here to listen to my podcast: https://open.spotify.com/show/5Nn7MhTB9HJSyQ0C6bMKXI
— — — — — — — — —
💰 FREE RESOURCES 💰
— — — — — — — — —
🛠 TOOLS OF THE TRADE 🛠
Software I use (TC2000): https://bit.ly/2HBdnBm
— — — — — — — — —
📱 FOLLOW SHAREPLANNER ON SOCIAL MEDIA 📱
FACEBOOK: https://facebook.com/shareplanner
*Disclaimer: Ryan Mallory is not a financial adviser and this podcast is for entertainment purposes only. Consult your financial adviser before making any decisions.

You Might Like

South Korea: The Hidden Driver of US Tech Volatility

Stop Trying to Hit Home Runs: Start Trading Within Your Means

How to Trade Breakouts Without Getting Trapped