
Technical Outlook:
- Huge rally again for a second day in a row, sending SPX up 56 points over that two-day stretch.
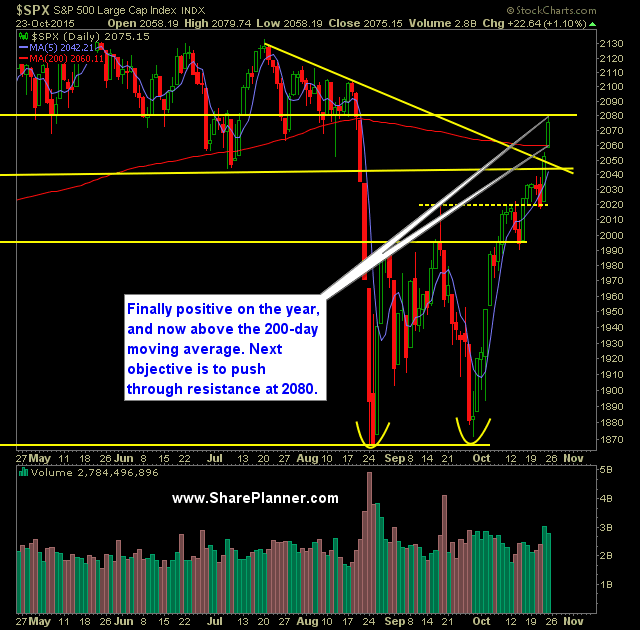
- Friday’s rally saw SPX get back into positive territory for the year.
- The 200-day moving average of SPX has now been broken.
- The rally was far from anything being broad-based. In fact the advancers vs. decliners only held a 1.3 to 1 advantage. Typically in a big rally, you see numbers of 3 or 4 to 1.
- Rally was primarily due in part to earnings beats by Amazon, Google, and Microsoft.
- Despite the rally of the past two days and the week prior, the T2108 (% of stocks trading above the 40-day moving average) has completely flat-lined. I am watching for a downside break at this point below 55% (currently at 65%). The flat-lining indicator is a major divergence against this market rally.
- To add to the mixed signals of Friday’s rally, VIX rallied off of 13.24 to finish at 14.35 and to finish a smidge higher on the day.
- The current rally is impressive, but with some of the observations mentioned above, there is reason to become more concerned with its ability to maintain the current pace.
- 30-minute chart suggests some consolidation or even a pullback of some type.
- Volume dropped off on SPY and was slightly below average on Friday.
- Downtrend off of the July highs was broken last week too.
- Ultimately, price on SPX is entering a range that has notoriously been difficult trading for most and one that vacillates consistently within a narrow range.
- 10-day moving average continues to be a strong barometer of market direction – a close below it would represent a significant market reversal.
- Essentially there are three resistance levels to watch: 1) Lower channel, range resistance at 2040 as shown below, 2) Declining resistance off of the July highs, which currently sits at 2039, and 3) 200-day moving average which also coincides with SPX’s break even level at 2059.
- The Fed has never raised interest rates at a point where the market was trading lower on the year. Currently SPX is trading in positive territory heading into Wednesday’s announcement.
My Trades:
- Sold FB on Friday at $102.23 for a 7.5% gain.
- Sold TYC on Friday at $36.91 for a 1.5% gain.
- Sold CVX on Friday at $90.57 for a 0.9% gain.
- Did not add any new swing-trades on Friday.
- 30% Long / 70% Cash
- Remain long: DIS at $105.88, MFC at $16.81, MSI at $70.66
- Will look to add 1-2 new long positions today on continued market strength.
- Join me each day for all my real-time trades and alerts in the SharePlanner Splash Zone
Chart for SPX:


Welcome to Swing Trading the Stock Market Podcast!
I want you to become a better trader, and you know what? You absolutely can!
Commit these three rules to memory and to your trading:
#1: Manage the RISK ALWAYS!
#2: Keep the Losses Small
#3: Do #1 & #2 and the profits will take care of themselves.
That’s right, successful swing-trading is about managing the risk, and with Swing Trading the Stock Market podcast, I encourage you to email me (ryan@shareplanner.com) your questions, and there’s a good chance I’ll make a future podcast out of your stock market related question.
Watching the dollars rise and fall in your trading account can turn a well-planned swing trade into an emotional, deeply personal decision. In this episode, I explain why focusing on price action, percentage returns, and R-multiples can help you avoid cutting winners early, holding losers too long, and abandoning your trading plan.
Be sure to check out my Swing-Trading offering through SharePlanner that goes hand-in-hand with my podcast, offering all of the research, charts and technical analysis on the stock market and individual stocks, not to mention my personal watch-lists, reviews and regular updates on the most popular stocks, including the all-important big tech stocks. Check it out now at: https://www.shareplanner.com/premium-plans
📈 START SWING-TRADING WITH ME! 📈
Click here to subscribe: https://shareplanner.com/tradingblock
— — — — — — — — —
💻 STOCK MARKET TRAINING COURSES 💻
Click here for all of my training courses: https://www.shareplanner.com/trading-academy
– The A-Z of the Self-Made Trader –https://www.shareplanner.com/the-a-z-of-the-self-made-trader
– The Winning Watch-List — https://www.shareplanner.com/winning-watchlist
– Patterns to Profits — https://www.shareplanner.com/patterns-to-profits
– Get 1-on-1 Coaching — https://www.shareplanner.com/coaching
— — — — — — — — —
❤️ SUBSCRIBE TO MY YOUTUBE CHANNEL 📺
Click here to subscribe: https://www.youtube.com/shareplanner?sub_confirmation=1
🎧 LISTEN TO MY PODCAST 🎵
Click here to listen to my podcast: https://open.spotify.com/show/5Nn7MhTB9HJSyQ0C6bMKXI
— — — — — — — — —
💰 FREE RESOURCES 💰
— — — — — — — — —
🛠 TOOLS OF THE TRADE 🛠
Software I use (TC2000): https://bit.ly/2HBdnBm
— — — — — — — — —
📱 FOLLOW SHAREPLANNER ON SOCIAL MEDIA 📱
*Disclaimer: Ryan Mallory is not a financial adviser and this podcast is for entertainment purposes only. Consult your financial adviser before making any decisions.

You Might Like

South Korea: The Hidden Driver of US Tech Volatility

Stop Trying to Hit Home Runs: Start Trading Within Your Means

How to Trade Breakouts Without Getting Trapped