
Technical Outlook: Yesterday’s bounce was significant in many ways. First, it came off of the price level where the market broke out of the double bottom base it had been in. That base breakout level held perfectly. Secondly, the bounce coincided with the 38.2% Fibonacci retracement level. Now, today, the market must follow through to the
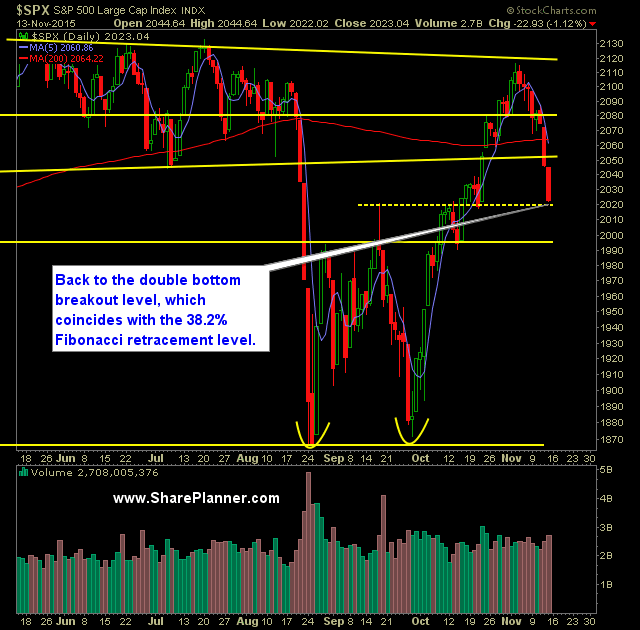
Technical Outlook: SPX sold off for a third straight day and for the seventh time in the last eight trading sessions. Current retracement has price back to the double bottom breakout as well as the 38.2% Fibonacci retracement level. All the major moving averages have been broken with the exception of the 50-day moving
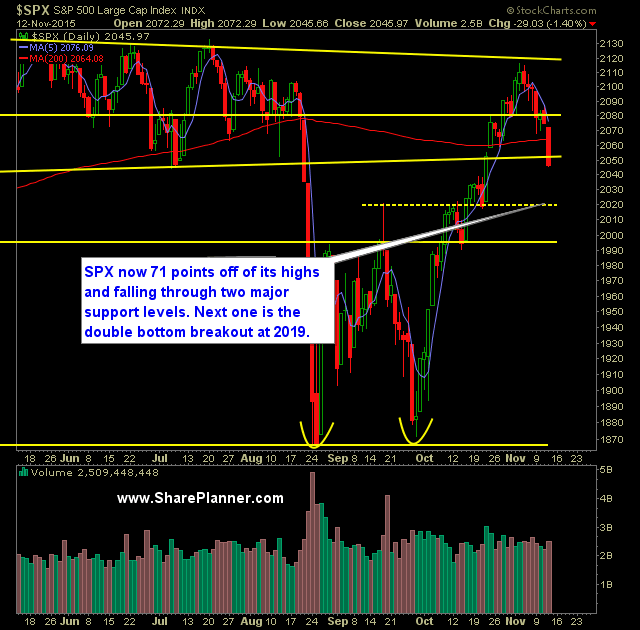
Technical Outlook: SPX had its strongest sell-off since the summer sell-off ended back in late October by dropping 1.4% yesterday. The 200-day moving average offered little to no support yesterday as price action sliced right through it. The Fibonacci retracements suggests a pullback to the 38.2% level at 2023 on SPX Head and shoulders pattern

Technical Outlook: SPX down in the pre market following some comments out of Bullard that was perceived as being hawkish, and of course bearish for the market and stocks. The 200-day moving average is the key level to watch here today. The 20-day moving average will be broken immediately at the market open. I am
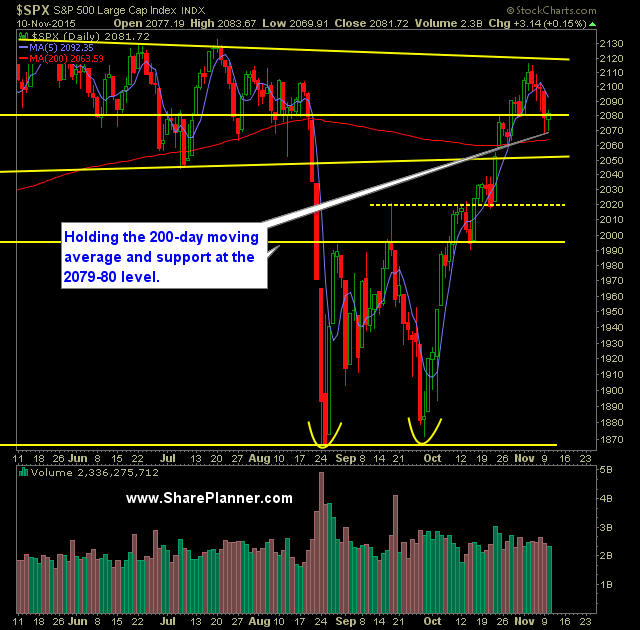
Technical Outlook: SPX managed to put a stop to the four-day sell-off yesterday and rally off of the 20-day and 200-day moving averages a slight bit. SPY volume dropped off again and was well below average. The price action of the last five trading days, despite four of them finishing lower, does not

Technical Outlook: Significant pullback that saw price on SPX pull back 1% yesterday . The converged 20 and 200-day moving averages will be a key testing point for the bulls today should the sell-off continue for a fifth straight day. Volume on SPY increased for a second straight day yesterday and came in
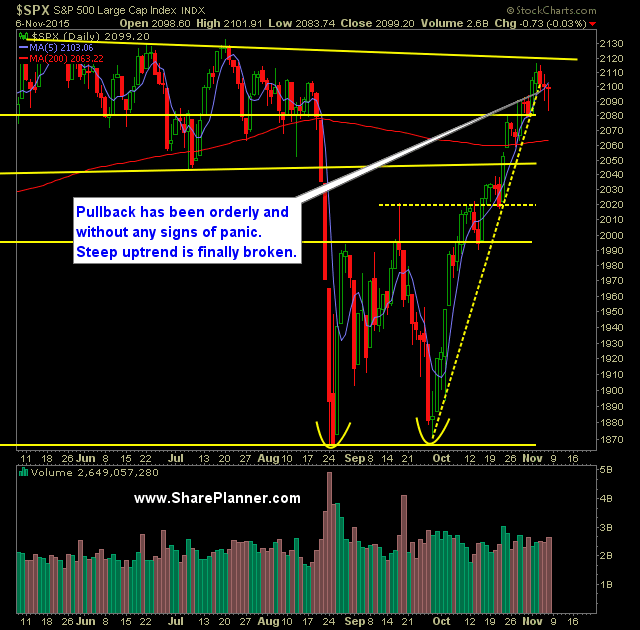
Technical Outlook: SPX had its first 3-day pullback since September and the first of this rally. Unlike previous sell-offs the 10-day moving average did break intraday. But like the October rally has done, it managed to close above it by the end of day. Volume saw a noticeable uptick on Friday, due mainly to

Technical Outlook: Second straight day of consolidation that saw price pullback to the 10-day moving average and hold, and close just above the 5-day moving average. This is a pattern that I have seen unfold consistently over the past five weeks that ultimately results in another push higher. It remains to be seen with today's

Technical Outlook: SPX pulled back for the first time on the week yesterday. Recent sell-offs have come in increments of two. Once again, Janet Yellen showed just how incompetent she is as head of the Federal Reserve. Spoke about raising rates in December as well as negative interest rates – all in the same breath.

Technical Outlook: Another respectable day for the market yesterday as the Russell continues to play catch up with the broader market rally. Steep decline off of the September lows, continues to hold. Though at some point in the near future, I expect this trend line, at the very least, to flatten out some and decrease

spc@shareplanner.com
(904) 800-8420
© Copyright 2025 | SharePlanner Inc. All Rights Reserved.
Disclaimer: The information provided on this website is for educational and informational purposes only. Ryan Mallory and/or SharePlanner are not licensed financial advisors, brokers, or tax professionals. The content on this site should not be considered as financial, investment, tax, or legal advice.
All information and opinions expressed herein are based on sources believed to be accurate and reliable. However, we make no representation or warranty as to their accuracy, completeness, or reliability. Any action you take upon the information on this website is strictly at your own risk.
Past performance is not indicative of future results. Investing involves risk, including the possible loss of principal. All investors should make their own decisions based on their specific investment objectives and financial circumstances.
This site may contain links to external websites that are not provided or maintained by or in any way affiliated with Ryan Mallory and/or SharePlanner. Please note that Ryan Mallory and/or SharePlanner do not guarantee the accuracy, relevance, timeliness, or completeness of any information on these external websites.
By using this website, you agree that Ryan Mallory and/or SharePlanner and any affiliated parties are not responsible for any losses or damages resulting from your use of or reliance on the information provided.
It is strongly recommended that you consult with a qualified professional before making any financial decisions.