
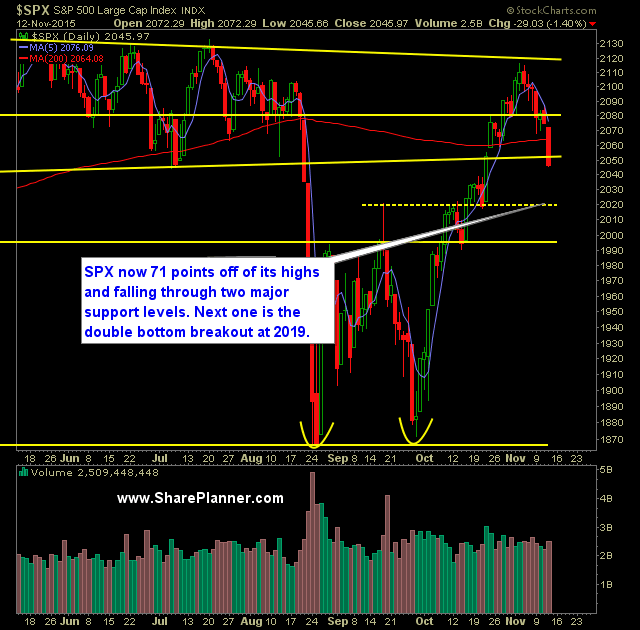
Technical Outlook:
- SPX had its strongest sell-off since the summer sell-off ended back in late October by dropping 1.4% yesterday.
- The 200-day moving average offered little to no support yesterday as price action sliced right through it.
- The Fibonacci retracements suggests a pullback to the 38.2% level at 2023 on SPX
- Head and shoulders pattern on 30 minute chart of SPX confirmed yesterday.
- SPY volume was at average levels and higher than what has been seen the last two days.
- T2108 (% of stocks trading above their 40-day moving average) dropped 17% to close at 43% and breaking out of its month long range in dramatic fashion.
- VIX spiked out of its range yesterday as well, rallying 14.4% to 18.37.
- At some point here soon, the market will be due for a dead cat bounce.
- Also lost in all the fuss yesterday was the 20-day moving average which had offered some support for SPX the previous two trading sessions.
- A rate hike is expected out of December’s Fed meeting. However, I still would not be surprised if the Fed backed out of raising rates yet again. They’ve been doing just that for years now.
My Trades:
- Added two new long positions to the portfolio yesterday.
- Closed out XLF yesterday for a 1.2% loss.
- Closed UPRO yesterday at 64.35 for a 1.8% loss.
- 60% Long / 40% Cash
- Remain long: CRM at $79.25, FDX at $157.91, FB at $107.34, and NFLX at $110.39
- Join me each day for all my real-time trades and alerts in the SharePlanner Splash Zone
Chart for SPX:


Welcome to Swing Trading the Stock Market Podcast!
I want you to become a better trader, and you know what? You absolutely can!
Commit these three rules to memory and to your trading:
#1: Manage the RISK ALWAYS!
#2: Keep the Losses Small
#3: Do #1 & #2 and the profits will take care of themselves.
That’s right, successful swing-trading is about managing the risk, and with Swing Trading the Stock Market podcast, I encourage you to email me (ryan@shareplanner.com) your questions, and there’s a good chance I’ll make a future podcast out of your stock market related question.
AI is quickly overtaking our everyday life, and in the process changing how we live our life too. But how does AI impact swing trading and what can we use AI for in order to better enhance our trading returns, and perhaps make it a little bit easier too? In this podcast episode, I cover how AI is impacting swing traders, and what it means for the stock market going forward.
Be sure to check out my Swing-Trading offering through SharePlanner that goes hand-in-hand with my podcast, offering all of the research, charts and technical analysis on the stock market and individual stocks, not to mention my personal watch-lists, reviews and regular updates on the most popular stocks, including the all-important big tech stocks. Check it out now at: https://www.shareplanner.com/premium-plans
📈 START SWING-TRADING WITH ME! 📈
Click here to subscribe: https://shareplanner.com/tradingblock
— — — — — — — — —
💻 STOCK MARKET TRAINING COURSES 💻
Click here for all of my training courses: https://www.shareplanner.com/trading-academy
– The A-Z of the Self-Made Trader –https://www.shareplanner.com/the-a-z-of-the-self-made-trader
– The Winning Watch-List — https://www.shareplanner.com/winning-watchlist
– Patterns to Profits — https://www.shareplanner.com/patterns-to-profits
– Get 1-on-1 Coaching — https://www.shareplanner.com/coaching
— — — — — — — — —
❤️ SUBSCRIBE TO MY YOUTUBE CHANNEL 📺
Click here to subscribe: https://www.youtube.com/shareplanner?sub_confirmation=1
🎧 LISTEN TO MY PODCAST 🎵
Click here to listen to my podcast: https://open.spotify.com/show/5Nn7MhTB9HJSyQ0C6bMKXI
— — — — — — — — —
💰 FREE RESOURCES 💰
— — — — — — — — —
🛠 TOOLS OF THE TRADE 🛠
Software I use (TC2000): https://bit.ly/2HBdnBm
— — — — — — — — —
📱 FOLLOW SHAREPLANNER ON SOCIAL MEDIA 📱
*Disclaimer: Ryan Mallory is not a financial adviser and this podcast is for entertainment purposes only. Consult your financial adviser before making any decisions.
You Might Like
Swing Trading Using Volume Analysis
The Psychology of Swing Trading and Winning the Mental Game
Building Your Trading Strategy for Lasting Success