
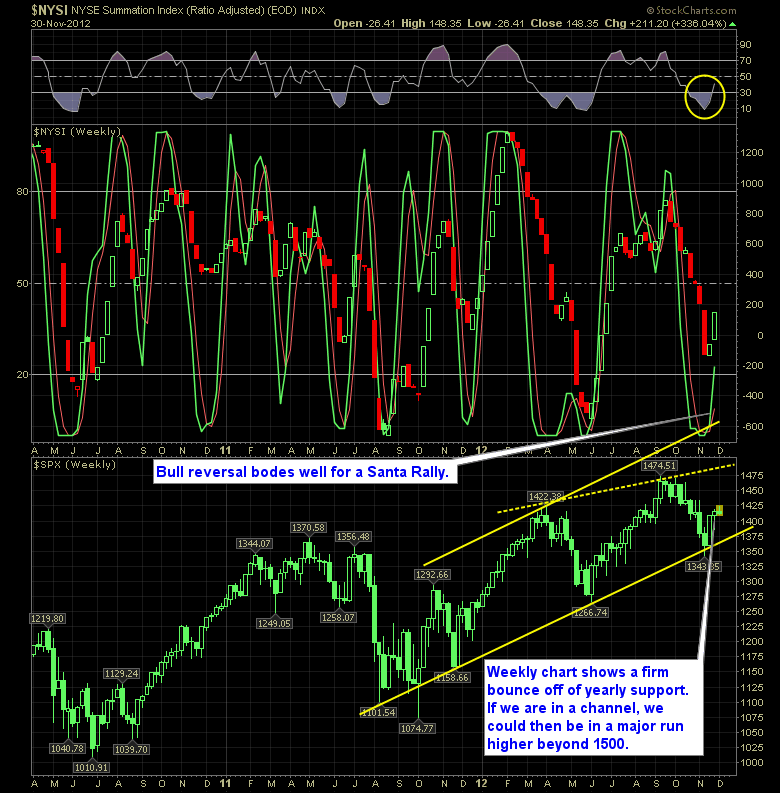
SPX shows the potential for a long-term channel pattern that we are trading inside of. But for it to continue, the market MUST break those September highs. Quick Glance at the Market Heat Map and Industries Notables: Huge bearish undertones in this market today. Banks, Tech, Materials all faltered. Utilities finally buckled as well.
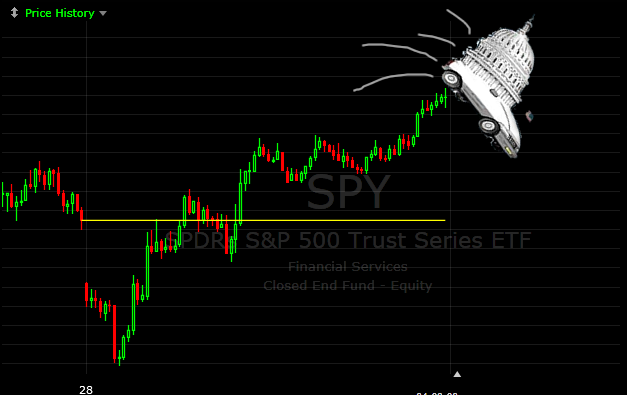
SPRI shows the Santa Rally is upon us I think a lot of bulls out there today are disappointed we are not ripping 20-30 points higher on a day that is notorious for being bullish. But we’re not and instead have given up all the day’s gains and then some, so far. However, the SharePlanner
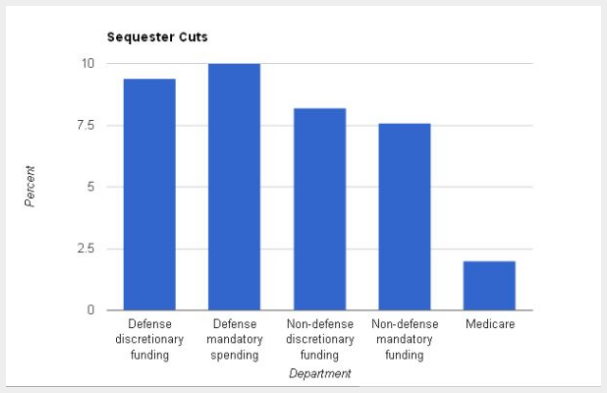
A quick glance at what programs and areas of the budget will be hit the hardest if sequestration takes place. Quick Glance at the Market Heat Map and Industries Notables: Utilities remained on the rise. Oil & Gas took a beating Discount Stores were on the move. The big technology names were off. Be
The stock market can go up all its wants but if Congress & President Obama doesn’t get mature and start cutting their spending habits, this is the outcome the stock market will be giving us. Quick Glance at the Market Heat Map and Industries Notables: Afternoon strength lifted the entire market. Healthcare recovered nicely.
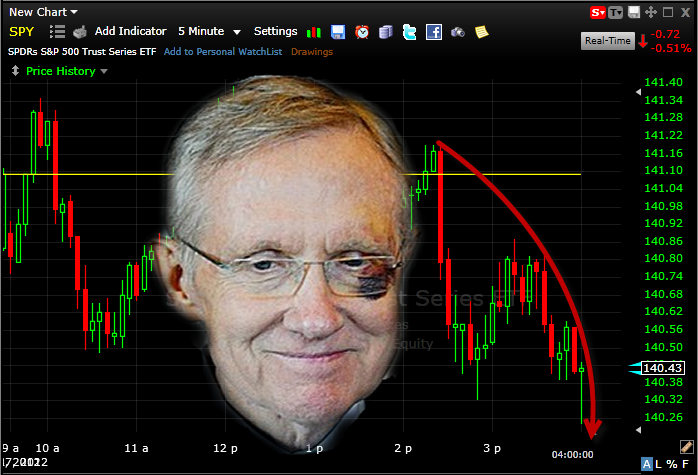
The Chart of the Day… It was Harry Reid’s Stock Market today, and he poison that came out of his mouth ruined a lot of gains for a lot of traders. Quick Glance at the Market Heat Map and Industries Notables: Utilities continue to hold their own. Basic Materials and Financials gave us another
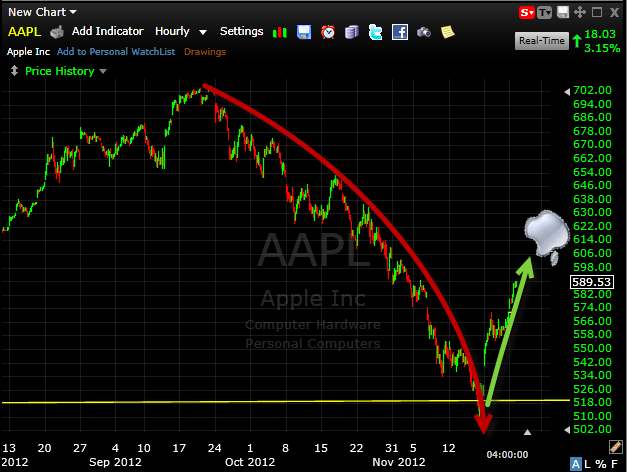
The Chart of the Day… Even dead, half-eaten Apples (AAPL) bounce. Quick Glance at the Market Heat Map and Industries Notables: Utilities and Apple were the only areas worth playing in to the long side. Basic Materials and Financials were horrendous. No Black Friday boost from Consumer Goods Be sure to check out
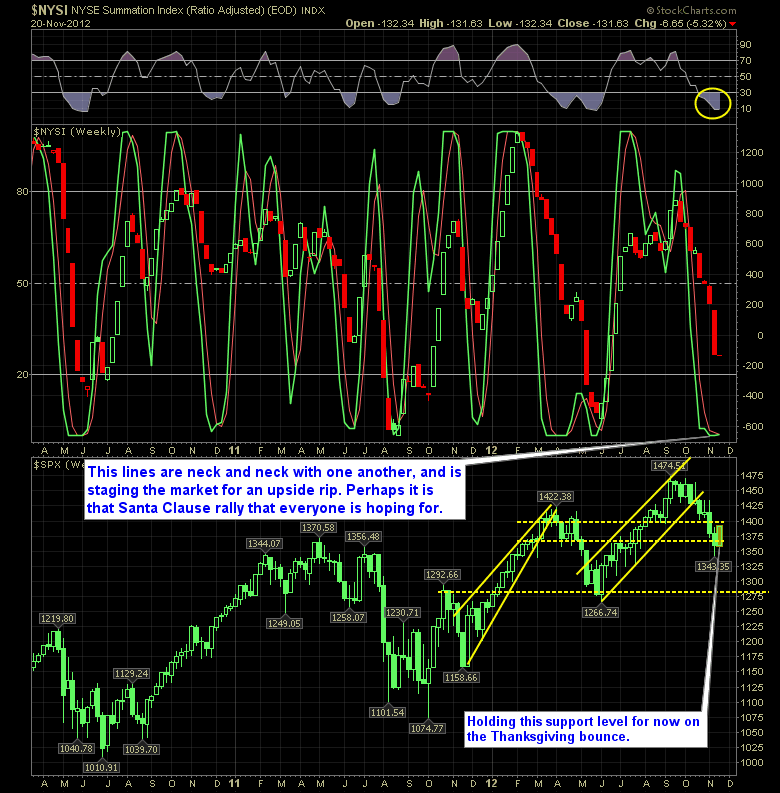
Reversal Indicator Points Towards the Start of the Christmas Rally This reversal indicator is keeping me very cautious in getting overly short. I honestly would like to get a bit heavier than my one short position that I currently have, but it scares me to do so based on this indicator below. In the past
The Chart of the Day… Quick Glance at the Market Heat Map and Industries Notables: Notables: Utilities lagged; Materials were consistently higher. Technology showed relative strength Everything else was hit or miss. Be sure to check out my latest swing trades and overall past performance
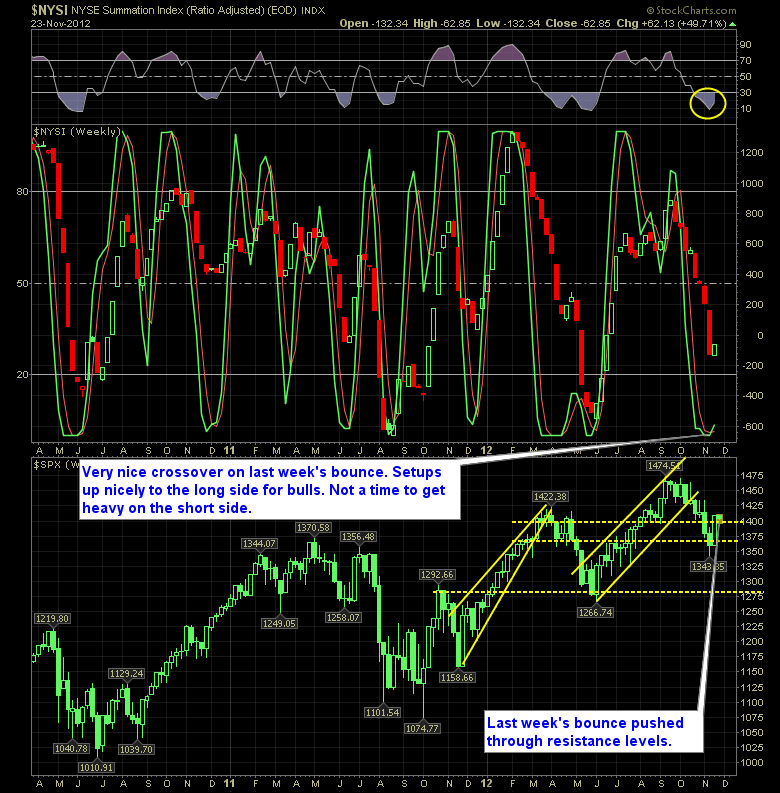
Reversal Indicator technicals shows the potential for a sustained bounce I’ve been skeptical of this week’s bounce believing that much of it has to do with the historic bullishness of Thanksgiving week, amid a very oversold market desperate to bounce, but we are showing on the SharePlanner Reversal Indicator below, a glaring signal for a
-
Reversal Indicator technicals shows the potential for a sustained bounce I’ve been skeptical of this week’s bounce believing that much of it has to do with the historic bullishness of Thanksgiving week, amid a very oversold market desperate to bounce, but we are showing on the SharePlanner Reversal Indicator below, a glaring signal for a

spc@shareplanner.com
(904) 800-8420
© Copyright 2025 | SharePlanner Inc. All Rights Reserved.
Disclaimer: The information provided on this website is for educational and informational purposes only. Ryan Mallory and/or SharePlanner are not licensed financial advisors, brokers, or tax professionals. The content on this site should not be considered as financial, investment, tax, or legal advice.
All information and opinions expressed herein are based on sources believed to be accurate and reliable. However, we make no representation or warranty as to their accuracy, completeness, or reliability. Any action you take upon the information on this website is strictly at your own risk.
Past performance is not indicative of future results. Investing involves risk, including the possible loss of principal. All investors should make their own decisions based on their specific investment objectives and financial circumstances.
This site may contain links to external websites that are not provided or maintained by or in any way affiliated with Ryan Mallory and/or SharePlanner. Please note that Ryan Mallory and/or SharePlanner do not guarantee the accuracy, relevance, timeliness, or completeness of any information on these external websites.
By using this website, you agree that Ryan Mallory and/or SharePlanner and any affiliated parties are not responsible for any losses or damages resulting from your use of or reliance on the information provided.
It is strongly recommended that you consult with a qualified professional before making any financial decisions.